SLIDE 1 11 Practicalities 2: Evaluating MT Systems
Now that we’ve talked about how to create machine translation systems and generate output, we’d like to know how well they are doing at generating good translations. This chapter is concerned with how to evaluate machine translation systems.
11.1 Manual Evaluation
⇥⇤⌅⇧⌃⌥ Taro visited Hanako the Taro visited the Hanako Hanako visited Taro
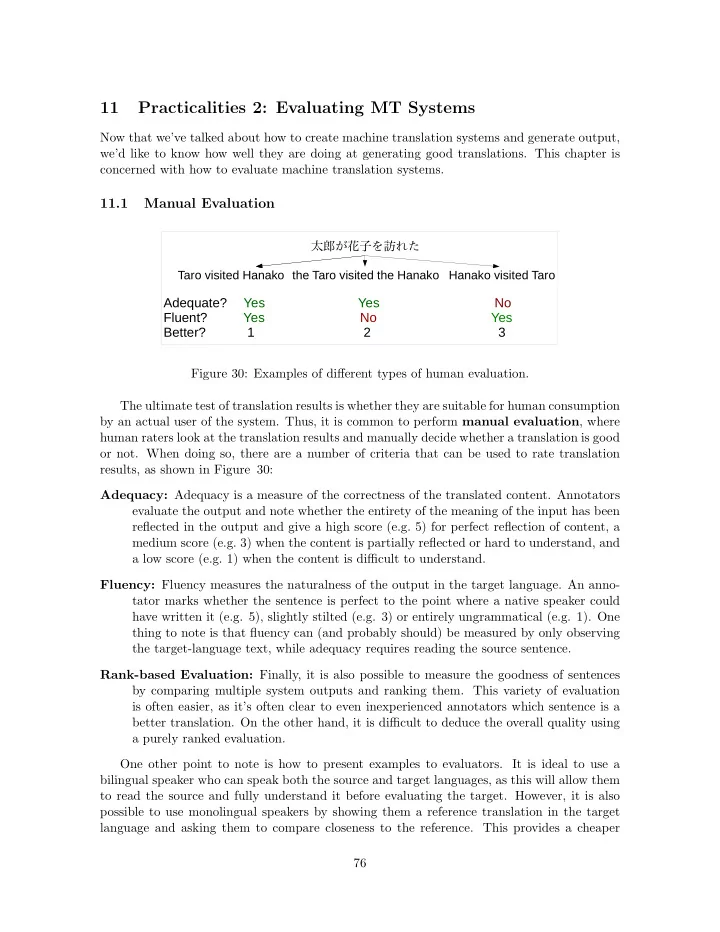
Adequate? Yes ⌦⌦⌦⌦⌦⌦↵ ↵ Yes No Fluent? ⌦ ↵ Yes No Yes Better? 1 2 3 Figure 30: Examples of different types of human evaluation. The ultimate test of translation results is whether they are suitable for human consumption by an actual user of the system. Thus, it is common to perform manual evaluation, where human raters look at the translation results and manually decide whether a translation is good
- r not. When doing so, there are a number of criteria that can be used to rate translation
results, as shown in Figure 30: Adequacy: Adequacy is a measure of the correctness of the translated content. Annotators evaluate the output and note whether the entirety of the meaning of the input has been reflected in the output and give a high score (e.g. 5) for perfect reflection of content, a medium score (e.g. 3) when the content is partially reflected or hard to understand, and a low score (e.g. 1) when the content is difficult to understand. Fluency: Fluency measures the naturalness of the output in the target language. An anno- tator marks whether the sentence is perfect to the point where a native speaker could have written it (e.g. 5), slightly stilted (e.g. 3) or entirely ungrammatical (e.g. 1). One thing to note is that fluency can (and probably should) be measured by only observing the target-language text, while adequacy requires reading the source sentence. Rank-based Evaluation: Finally, it is also possible to measure the goodness of sentences by comparing multiple system outputs and ranking them. This variety of evaluation is often easier, as it’s often clear to even inexperienced annotators which sentence is a better translation. On the other hand, it is difficult to deduce the overall quality using a purely ranked evaluation. One other point to note is how to present examples to evaluators. It is ideal to use a bilingual speaker who can speak both the source and target languages, as this will allow them to read the source and fully understand it before evaluating the target. However, it is also possible to use monolingual speakers by showing them a reference translation in the target language and asking them to compare closeness to the reference. This provides a cheaper 76
SLIDE 2 alternative but also suffers problems of accuracy in the evaluation because annotators can be inappropriately influenced by surface-level overlaps with the reference.
11.2 Automatic Evaluation and BLEU
While manual evaluation is generally preferable in situations where we can afford to do so, it is also time consuming and costly to check translations one-by-one by hand. Because of this, it is common to use automatic evaluation as a proxy instead. The core idea behind automatic evaluation is that it is possible to automatically calculate evaluation scores by comparing the system output to one or more human-created reference translations. The closer the system
- utput is to the reference translation, the higher the evaluation score becomes.
11.2.1 BLEU Score The most widely used automatic evaluation score is BLEU [11] score. BLEU is based on two elements: n-gram Precision: Of the n-grams output by the machine translation system, what per- centage appear in a reference sentence? Brevity Penalty: Because the n-gram precision focuses on accuracy of the output words,
- ne way to game the system would be to output very short sentences that only consist
- f n-grams that the model is very sure about. The brevity penalty puts a penalty on
sentences that are shorter than the reference, preventing these short sentences from receiving an unnecessarily high score. To write this precisely, we first define ¯ e = ¯ e1, . . . , ¯ en as an arbitrary n-gram of length n. We then define a function
e) (94) that returns the number of times that ¯ e occurs in sentence E. Finally, we define two functions, an n-gram count function that counts the number of n-grams of length n in the system output ˆ E: count( ˆ E, n) = X
¯ e2{¯ e;|¯ e|=n}
E, ¯ e) (95) = |E| + 1 n (96) as well as an n-gram match function match-n(E, ˆ E, n) (97) that counts the number of times that a particular n-gram occurs in both the system output and reference E:31 match(E, ˆ E, n) = X
¯ e2{¯ e;|¯ e|=n}
min(occur(E, ¯ e), occur( ˆ E, ¯ e)). (98)
31Because there are multiple correct ways to translate a particular sentence, it is also common to perform
evaluation using multiple correct human references. In this case, the count function for the references can be modified to return the maximum number of times a particular n-gram occurs in any of the references. In general, increasing the number of references makes evaluation more robust to superficial variations in the
- utput and increases evaluation accuracy.
77
SLIDE 3 0.2 0.4 0.6 0.8 1 1.2 0.2 0.4 0.6 0.8 1 1.2
brevity penalty
Figure 31: The brevity penalty in BLEU. Then, given a full corpus of system outputs ˆ E and references E, we accumulate the counts and matches over each sentence in the corpus. count( ˆ E, n) = X
ˆ E2E
count( ˆ E, n) (99) match(E, ˆ E, n) = X
hE, ˆ Ei2hE, ˆ Ei
match(E, ˆ E, n) (100) (101) We then can calculate the n-gram precision for the corpus as the number of matches divided by the number of n-grams output: prec(E, ˆ E, n) = match(E, ˆ E, n) count( ˆ E, n) . (102) The brevity penalty is designed to penalize system outputs that are shorter than the reference, and is multiplied with the n-gram precision terms of the BLEU score, so a lower value for the brevity penalty indicates that the score will be penalized more. Specifically, it is calculated according to the following equations, which are also shown in Figure 31 brev(E, ˆ E) = 8 < : 1 if count( ˆ E, 1) > count(E, 1) e
1 count(E,1)
count( ˆ E,1)
(103) As can be seen in the figure, no penalty will be imposed when the output is longer than the reference, and the penalty reduces the score to zero as the length ratio reduces to zero. Finally, combining all of these together, we take the geometric mean of the n-gram preci- sions up to a certain length of n (almost always 4, following the original paper) and multiply it with the brevity penalty: BLEU(E, ˆ E) = brev(E, ˆ E) ⇤ exp(
4
X
n=1
log prec(E, ˆ E, n)). (104) 78
SLIDE 4 11.2.2 Notes on BLEU and Automatic Evaluation BLEU score is a very convenient tool in that it makes it possible to automatically evaluate systems without spending additional human effort. However, it is important to keep a few things in mind when using it for evaluation. Comparability: First, it is important to note that while BLEU score is useful to compare the output of multiple systems on the same data set and translation task, there is little meaning in the actual value of the BLEU score itself. For example, even if we have a BLEU score of 30 for English-German translation, and a BLEU score of 32 for German-English translation, this does not mean that our German-English results are better, because the target languages are different. The same is true for results on different data-sets. This is because BLEU is affected by a number of factors, particularly the length of the sentences in the test corpus (corpora with shorter sentences will generally receive higher BLEU scores), and the length of the words in the language (languages like German that have longer words will generally get a lower BLEU score than languages like English, which has comparatively shorter words). In addition, even with the same data set, the BLEU score can be influenced by the tokenizer used to split the test data into tokens (which affects the n-gram counts), or whether the tokens are lowercased before performing evaluation (where lowercasing will result in a higher score). Because of this, when comparing systems it is essential to ensure that the evaluation settings are identical to be able to fairly compare results. This is explained in detail in [13], and many of these recommendations are implemented in the sacreBLEU toolkit.32 Corpus Level vs. Sentence Level: In the description above, BLEU was described
- n the corpus level; all statistics are aggregated over the entire corpus before calculating
precisions, brevity penalties, etc. However, in some cases (for example, for optimization as described in Section 18), it is convenient to calculate BLEU score over sentences. Of course, it is trivial to calculate BLEU over a single sentence by treating E and ˆ E as a corpus with a single sentence. However, for many sentences, it’s often the case that not a single 4-gram will match with the reference, and thus the sentence will be given a BLEU score of 0, even if some portion of the words have matched. To improve the robustness of BLEU to these short inputs, it’s common to use smoothed BLEU or BLEU+1 [7], which re-defines the n-gram precision to smooth n-grams with n > 1 by adding one to their numerator and denominator: prec+1(E, ˆ E, n) = 8 < :
match(E, ˆ E,1) count( ˆ E,1)
if n = 1
match(E, ˆ E,n)+1 count( ˆ E,n)+1
(105) By smoothing all n-grams where n > 1, we can ensure that unless there is not a single unigram match, the score will be greater than zero. This improves robustness to sentence-level inputs, but also has some problems of its own, such as favoring inputs that are shorter than the reference [10].
11.3 Significance and Stability Concerns
One more important thing to consider when evaluating systems is how trustworthy the results are and whether a difference in score between two systems actually represents a difference in accuracy between two systems. For example, if one model gets a score of 30.1, and another gets
32https://github.com/mjpost/sacreBLEU
79
SLIDE 5 a score of 30.2, there’s a good chance that there is no real difference between the systems, and this is just a coincidence of some sort of randomness in our particular experimental setting.33 Randomness in Data Selection: The first concern that we may have is that the difference in scores is an artifact of the particular data that we used; if we chose another test set, even one with very similar characteristics to our current test set, it might affect the results enough that the relative accuracy of the systems may change. The go-to method to measure the effect of this data selection on translation results is bootstrap resampling [6]. The basic idea behind bootstrap resampling is that we measure our translation accuracy on random subsets of the actual test set. If one system is consistently better on all subsets, then we can assume that the changes are stable, but if the winner changes depending on the subset
- f data selected, then the results are likely due to random noise in the data.
This algorithm can be used to measure two things: how much variance there is in the evaluation scores for a single system (which is the standard bootstrap method) and how certain it is that a particular system is better than another (which is called the paired bootstrap method). The standard bootstrap, run over M subsets of the data, is shown in Algorithm 4. In Line 2, we first initialize an empty set of scores b. In the loop from Lines 3-7, we perform M steps of bootstrapping, where in practice it is often preferable to set M = 1000 to M = 10000. In Line 4, we sample a subset of the test data, where in practice we usually use exactly half of the sentences in the test data. In Line 5, we calculate the evaluation score, such as BLEU score or any of the human evaluation scores above, and in Line 6, we add it to the set of evaluation scores. In Line 8, we sort the scores, and in line 9, we take the score that is 2.5% from the bottom, and the score that is 2.5% from the top. We can then treat everything that is within these bounds as our 95% confidence interval, and everything that falls outside of these bounds as outliers that we only expect to see 5% of the time. This will give us a good idea of the general range of evaluation scores that we may expect to see if we performed translation of other similar data. Algorithm 4 Standard bootstrap resampling over M random subsets of the reference corpus E and system output ˆ
- E. Finds 95% confidence intervals.
1: procedure Bootstrap 2:
b {}
3:
for t from 1 to M do
4:
Subsample hE0, ˆ E0i 2 hE, ˆ Ei
5:
Calculate evaluation function for subset b0 = eval(E0, ˆ E0)
6:
Add b0 to set b
7:
end for
8:
Sort b in ascending order of score
9:
b’s (M ⇤ 0.025)th and (M ⇤ 0.975)th elements are lower and upper confidence bounds
10: end procedure
Now, let’s think about comparing two systems and trying to decide the confidence with which we can say one of the two systems is better than the other. One way we could do so is run the standard bootstrapping algorithm above, calculate the confidence intervals for each system, and if the confidence intervals overlap, say there is no significance difference,
33These concerns hold equally for both manual and automatic evaluation.
80
SLIDE 6
if the confidence intrervals do not overlap then report a significant difference. However, this is making our job unnecessarily hard because it ignores the fact that the results of two systems tend to co-vary; if System 1 performs poorly on a particular subset of the test data, it might simply be because the dataset happens to be a difficult one, and System 2 will also perform poorly there. Thus, a method that considers this co-variance will be significantly more accurate and sensitive to differences between systems, and pick up on differences more easily. A method that takes this intuition into account is paired bootstrapping. The details are shown in Algorithm 5, which takes translation results from System 1 ˆ E(1) and System 2 ˆ E(2) and measures the probability that each is better than the other. Here the major loop between Lines 2-14 is very similar to the previous standard bootstrapping algorithm, but instead of measuring the score for a single system, we measure whether each system won or lost on each subset of the data. The percentage of time that a particular system won can be interpreted as the likelihood that that particular system is in fact the better system overall. Algorithm 5 Paired bootstrap resampling over M random subsets of the reference corpus E and two system outputs ˆ E(1) and ˆ E(2).
1: procedure PairedBootstrap 2:
cwin1 0, cwin2 0, ctie 0
3:
for t from 1 to M do
4:
Subsample hE0, ˆ E(1)0, ˆ E(2)0i 2 hE, ˆ E(1), ˆ E(2)i
5:
Calculate b(1)0 = eval(E0, ˆ E(1)0)
6:
Calculate b(2)0 = eval(E0, ˆ E(2)0)
7:
if b(1)0 > b(2)0 then
8:
cwin1 cwin1 + 1
9:
else if b(1)0 < b(2)0 then
10:
cwin2 cwin2 + 1
11:
else
12:
ctie ctie + 1
13:
end if
14:
end for
15:
cwin1/M, cwin2/M, and ctie/M are the win and tie probabilities
16: end procedure
Randomness in Training: The above bootstrapping approaches are effective in helping to account for randomness in our selection of test data. One other factor that can result in randomness and instability of results is the fact that each run of training an MT model may result in different results, even on exactly the same data. For example, in the neural MT models that we’ve covered so far, there is random initialization of parameters, random shuffling of the training data, etc. Similarly to the bootstrapping method above, this problem can be solved by performing multiple training runs and averaging the results among these training runs. Unfortunately however, because training is time consuming, it is usually not possible to run M = 1000 or M = 10000 random restarts, like we did in the bootstrapping procedure. Based on empirical experiments, [3] note that while more runs are better, running training at least M = 3 times is enough to guarantee some amount of stability. 81
SLIDE 7 11.4 Other Automatic Evaluation Metrics
Next, we will turn to evaluation metrics other than BLEU. BLEU was one of the first au- tomatic metrics used in measuring translation accuracy and has actually stood the test of time relatively well; as a general-purpose metric of translation quality it is easy to compute and relatively well correlated with human evaluation (more in Section 11.5), even compared to some more recent methods. However, evaluating MT accuracy automatically is far from a solved problem, and there are a number of metrics, some general purpose and some more focused on a particular part of evaluation. Some major ones are outlined below: METEOR [4] is a highly engineered evaluation metric that is perhaps second to BLEU in popularity, and consistently scores well in evaluations of evaluation metric quality. METEOR is a combination of several ideas, including using paraphrases to give partial credit when a translation uses words that are semantically similar to the reference and weighting content words more than function words. METEOR also allows the tuning
- f several weights to optimize correlation with human evaluation metrics, and these
weights can be tuned on a language-by-language or task-by-task basis. Translation Edit Rate (TER) [14] is another widely used metric. The idea behind TER is that it correlates with the number of edits that would be needed to transform an automatically generated translation into the reference translation. In commercial use of machine translation, it is common to use MT as a first pass before a translator goes in and fixes the translation, post-editing, and TER could be expected to be correlated with the effort required therefor. Human TER (HTER) measures this number of edits directly, by asking a human to modify the output to create a reference before measuring TER. Focused measures focus on a particular insight of what should be important in the transla- tion task. For example, MEANT [8] focuses on attempting to automatically determine which semantic roles (who did what to whom). RIBES [5] focuses on whether the trans- lation gets the reordering correct and is useful for languages that have highly disparate word order.
11.5 Meta-evaluation
Given that there are a large number of solutions for automatic evaluation, we would like to know which one we should be using. The most common way of doing so is by creating human evaluations for a small set of data using methods described in Section 11.1, then measuring the correlation between the human and automatic evaluation measures. Two common ways to measure correlation in this setting are: Pearson’s correlation: This coefficient measures how much of a linear correlation exists between the automatic and manual evaluation measures. If the relationship between the two evaluation measures is entirely linear, the value will be one, and if there is no relationship it will be zero. Spearman’s rank correlation: This coefficient whether the ranking between the human evaluation is similar to that of automatic evaluation. If the ranking between human and 82
SLIDE 8 manual evaluation is identical, then the score will be one, if there is no correlation, the score will be zero, and if the ranking is inverse, the score will be negative one. In general, we tend to care more about the rankings of systems than the absolute values of scores, so Spearman’s rank correlation tends to be favored in meta-evaluation of evaluation measures.
11.6 Further Reading
There are also a number of other topics in evaluation: Extrinsic Evaluation: One thing to note is that all of the evaluation metrics introduced here may tell us whether a translation is accurate or not, but they may not tell us whether it is useful or not.34 Extrinsic evaluation instead measures whether translation results can be used in a particular task. For example, [9] measure whether speech translation results can be used to aid understanding of content, and [15] examine whether machine translation results can be used by a down-stream automatic question answering system. Crowdsourcing: One way to get human evaluation of machine translation results in a more cost-effective way is by utilizing crowdsourcing services [2]. These services are cheap but also raise a number of issues, such as how to ensure that the raters are actually providing quality evaluations. More Sophisticated Error Analysis: Even after getting a single score, it becomes very important to know exactly what is going wrong or right with a particular system. When developing new systems, a good, but time-consuming way to do so, is to look at trans- lations from a baseline system and your proposed system, and classify the errors that each system makes into a typology of different mistakes (e.g. dropping words, substi- tuting words, etc.), such as the one proposed by [16]. In order to make this analysis more efficient, it is also possible to attempt to automatically identify certain types of errors into particular classes [12], or calculate statistics about particular word strings that one system tends to be better at producing than the other [1]. Some of these methods are implemented in open source tools that can be used for error analysis, such as compare-mt.py.35
11.7 Exercise
Implement BLEU score with paired bootstrap resampling to measure the statistical signifi- cance of differences between translation results of two systems. Use this to measure whether the difference between your encoder-decoder and attentional translation models is statistically
- significant. With regards to BLEU, I recommend that you try implementing it yourself for
learning purposes, then compare your scores against an existing canonical implementation such as https://github.com/moses-smt/mosesdecoder/blob/master/scripts/generic/
34With the potential exception of TER, which may be correlated with usefulness in post-editing. 35https://github.com/neulab/compare-mt
83
SLIDE 9 multi-bleu.perl.36 It is also OK to just call this canonical implementation as an external function, and implement just the paired bootstrap resampling. Potential improvements to the evaluation include:
- Implementing another evaluation metric.
- Taking a look at the Conference on Machine Translation’s evaluation track data (http:
//statmt.org/wmt16/metrics-task/) and measuring the correlation between human evaluation and BLEU or another metric.
References
[1] Koichi Akabe, Graham Neubig, Sakriani Sakti, Tomoki Toda, and Satoshi Nakamura. Discrimi- native language models as a tool for machine translation error analysis. In Proceedings of the 25th International Conference on Computational Linguistics (COLING), pages 1124–1132, 2014. [2] Luisa Bentivogli, Marcello Federico, Giovanni Moretti, and Michael Paul. Getting expert quality from the crowd for machine translation evaluation. Proc. MT Summmit, 13:521–528, 2011. [3] Jonathan H. Clark, Chris Dyer, Alon Lavie, and Noah A. Smith. Better hypothesis testing for statistical machine translation: Controlling for optimizer instability. In Proceedings of the 49th Annual Meeting of the Association for Computational Linguistics (ACL), pages 176–181, 2011. [4] Michael Denkowski and Alon Lavie. Meteor universal: Language specific translation evaluation for any target language. In Proceedings of the 9th Workshop on Statistical Machine Translation (WMT), 2014. [5] Hideki Isozaki, Tsutomu Hirao, Kevin Duh, Katsuhito Sudoh, and Hajime Tsukada. Automatic evaluation of translation quality for distant language pairs. In Proceedings of the 2010 Conference
- n Empirical Methods in Natural Language Processing (EMNLP), pages 944–952, 2010.
[6] Philipp Koehn. Statistical significance tests for machine translation evaluation. In Proceedings
- f the 2004 Conference on Empirical Methods in Natural Language Processing (EMNLP), pages
388–395, 2004. [7] Chin-Yew Lin and Franz Josef Och. Orange: a method for evaluating automatic evaluation metrics for machine translation. In Proceedings of the 20th International Conference on Computational Linguistics (COLING), pages 501–507, 2004. [8] Chi-kiu Lo and Dekai Wu. Meant: An inexpensive, high-accuracy, semi-automatic metric for evaluating translation utility based on semantic roles. In Proceedings of the 49th Annual Meeting
- f the Association for Computational Linguistics (ACL), pages 220–229, 2011.
[9] D. Mostefa, O. Hamon, and K. Choukri. Evaluation of Automatic Speech Recognition and Speech Language Translation within TC-STAR: Results from the first evaluation campaign. In Proceed- ings of the 5th International Conference on Language Resources and Evaluation (LREC), 2006. [10] Preslav Nakov, Francisco Guzman, and Stephan Vogel. Optimizing for sentence-level BLEU+1 yields short translations. In Proceedings of the 24th International Conference on Computational Linguistics (COLING), pages 1979–1994, 2012.
36The reason why it is necessary to compare against an existing canonical implementation is because while
small differences in model implementations are common, small differences in evaluation measures can impact the validity of experimental comparison (similarly for tokenization as mentioned subsubsection 11.2.2).
84
SLIDE 10 [11] Kishore Papineni, Salim Roukos, Todd Ward, and Wei-Jing Zhu. BLEU: a method for automatic evaluation of machine translation. In Proceedings of the 40th Annual Meeting of the Association for Computational Linguistics (ACL), pages 311–318, 2002. [12] Maja Popovi´ c and Hermann Ney. Word error rates: Decomposition over POS classes and applica- tions for error analysis. In Proceedings of the Second Workshop on Statistical Machine Translation, pages 48–55, 2007. [13] Matt Post. A call for clarity in reporting bleu scores. arXiv preprint arXiv:1804.08771, 2018. [14] Matthew Snover, Bonnie Dorr, Richard Schwartz, Linnea Micciulla, and John Makhoul. A study
- f translation edit rate with targeted human annotation. In Proceedings of the Conference of the
Association for Machine Translation in the Americas (AMTA), pages 223–231, 2006. [15] Kyoshiro Sugiyama, Masahiro Mizukami, Graham Neubig, Koichiro Yoshino, Sakriani Sakti, Tomoki Toda, and Satoshi Nakamura. An investigation of machine translation evaluation metrics in cross-lingual question answering. In Proceedings of the 10th Workshop on Statistical Machine Translation (WMT), 2015. [16] David Vilar, Jia Xu, Luis Fernando d’Haro, and Hermann Ney. Error analysis of statistical machine translation output. In Proceedings of the 5th International Conference on Language Resources and Evaluation (LREC), pages 697–702, 2006.
85