
SLIDE 1
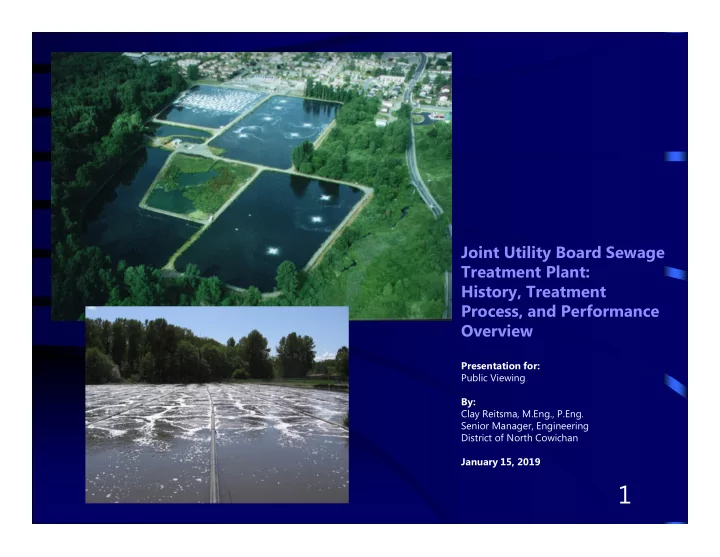
Joint Utility Board Sewage Treatment Plant: History, Treatment Process, and Performance Overview
Presentation for: Public Viewing By: Clay Reitsma, M.Eng., P.Eng. Senior Manager, Engineering District of North Cowichan January 15, 2019