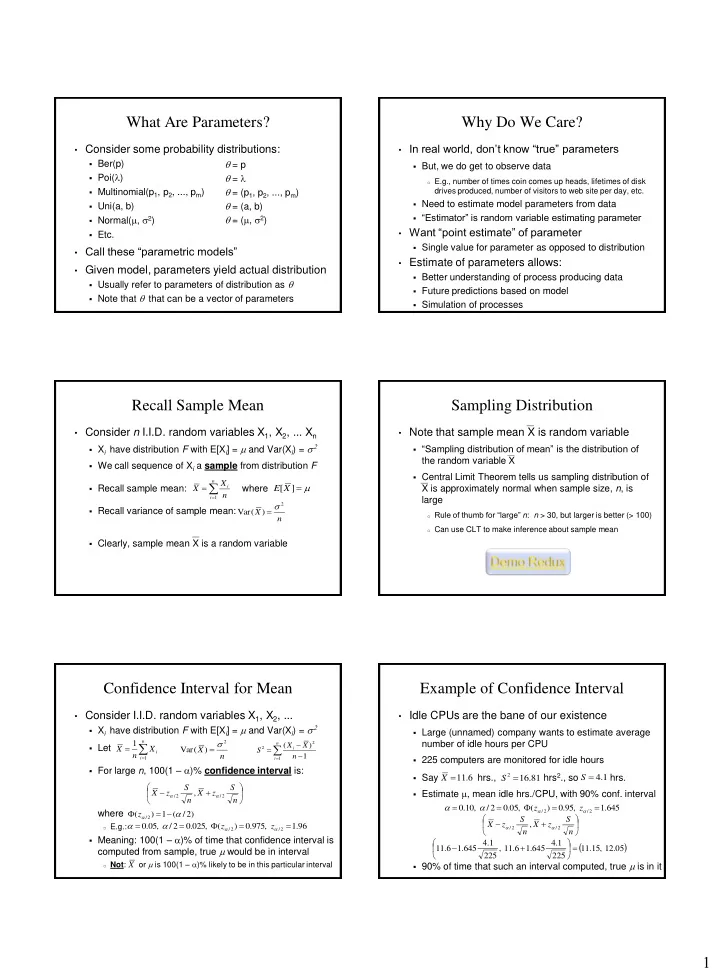
1 Method of Moments Examples of Method of Moments 1 n - - PDF document

1
SMART_READER_LITE
LIVE PREVIEW

1 Method of Moments Examples of Method of Moments 1 n - - PDF document

What Are Parameters? Why Do We Care? In real world, dont know true parameters Consider some probability distributions: = p Ber(p) But, we do get to observe data Poi( l ) = l o E.g., number of times coin comes up


slide-1
SLIDE 1

1 What Are Parameters?

  • Consider some probability distributions:
  • Ber(p)
  • Poi(l)
  • Multinomial(p1, p2, ..., pm)
  • Uni(a, b)
  • Normal(m, 2)
  • Etc.
  • Call these “parametric models”
  • Given model, parameters yield actual distribution
  • Usually refer to parameters of distribution as 
  • Note that  that can be a vector of parameters

 = p  = l  = (p1, p2, ..., pm)  = (a, b)  = (m, 2)

Why Do We Care?

  • In real world, don’t know “true” parameters
  • But, we do get to observe data
  • E.g., number of times coin comes up heads, lifetimes of disk

drives produced, number of visitors to web site per day, etc.

  • Need to estimate model parameters from data
  • “Estimator” is random variable estimating parameter
  • Want “point estimate” of parameter
  • Single value for parameter as opposed to distribution
  • Estimate of parameters allows:
  • Better understanding of process producing data
  • Future predictions based on model
  • Simulation of processes

Recall Sample Mean

  • Consider n I.I.D. random variables X1, X2, ... Xn
  • Xi have distribution F with E[Xi] = m and Var(Xi) = 2
  • We call sequence of Xi a sample from distribution F
  • Recall sample mean: where
  • Recall variance of sample mean:
  • Clearly, sample mean X is a random variable

n i i

n X X

1

m  ] [X E

n X

2

) ( Var  

Sampling Distribution

  • Note that sample mean X is random variable
  • “Sampling distribution of mean” is the distribution of

the random variable X

  • Central Limit Theorem tells us sampling distribution of

X is approximately normal when sample size, n, is large

  • Rule of thumb for “large” n: n > 30, but larger is better (> 100)
  • Can use CLT to make inference about sample mean

Confidence Interval for Mean

  • Consider I.I.D. random variables X1, X2, ...
  • Xi have distribution F with E[Xi] = m and Var(Xi) = 2
  • Let
  • For large n, 100(1 – a)% confidence interval is:

where

  • E.g.:
  • Meaning: 100(1 – a)% of time that confidence interval is

computed from sample, true m would be in interval

  • Not: or m is 100(1 – a)% likely to be in this particular interval

n i i

X n X

1

1         n S z X n S z X

2 / 2 /

,

a a

n X

2

) ( Var  

  

n i i

n X X S

1 2 2

1 ) (

) 2 / ( 1 ) (

2 /

a

a

   z 96 . 1 , 975 . ) ( , 025 . 2 / , 05 .

2 / 2 /

    

a a

a a z z X

Example of Confidence Interval

  • Idle CPUs are the bane of our existence
  • Large (unnamed) company wants to estimate average

number of idle hours per CPU

  • 225 computers are monitored for idle hours
  • Say hrs., hrs2., so hrs.
  • Estimate m, mean idle hrs./CPU, with 90% conf. interval
  • 90% of time that such an interval computed, true m is in it

6 . 11  X 81 . 16

2 

S 645 . 1 , 95 . ) ( , 05 . 2 / , 10 .

2 / 2 /

    

a a

a a z z 1 . 4  S

 

05 . 12 , 15 . 11 225 1 . 4 645 . 1 6 . 11 , 225 1 . 4 645 . 1 6 . 11                  n S z X n S z X

2 / 2 /

,

a a

slide-2
SLIDE 2

2 Method of Moments

  • Recall: n-th moment of distribution for variable X:
  • Consider I.I.D. random variables X1, X2, ..., Xn
  • Xi have distribution F
  • Let
  • are called the “sample moments”
  • Estimates of the moments of distribution based on data
  • Method of moments estimators
  • Estimate model parameters by equating “true”

moments to sample moments:

  

  

  

n i k i k n i i n i i

X n m X n m X n m

1 1 2 2 1 1

1 ˆ ... 1 ˆ 1 ˆ

] [

n n

X E m 

i

m ˆ

i i

m m ˆ 

Examples of Method of Moments

  • Recall the sample mean:
  • This is method of moments estimator for E[X]
  • Method of moments estimator for variance
  • Estimate second moment:
  • Estimate:
  • Recall sample variance:

n i i

X n m

1 2 2

1 ˆ ] [ ˆ 1

1 1

X E m X n X

n i i

   

 2 2

]) [ ( ] [ ) ( Var X E X E X  

2 1 2

) ˆ ( ˆ ) ( Var m m X  

n X X X n X n X X n

n i i n i n i i n i i

   

   

           

1 2 2 1 2 1 2 2 1 2

) ( 1 1 1 ) ) ˆ ( ˆ ( 1 1 ) ( 1 ) 2 ( 1 ) (

2 1 2 1 2 2 1 2 2 1 2 2

m m n n n X X n X X X X n X X S

n i i n i i i n i i

            

  

  

Small Samples = Problems

  • What is difference between sample variance and

MOM estimate for variance?

  • Imagine you have a sample of size n = 1
  • What is sample variance?
  • I.e., don’t really know variability of data
  • What is MOM estimate of variance?
  • I.e., have complete certainty about distribution!
  • There is no variance

1 ) ( ) (

1 1 2 2 1 2 2

   

 

  i i i n i i

X X n X X undefined    

 n i i

n X X S

1 2 2

1 ) (

Estimator Bias

  • Bias of estimator:
  • When bias = 0, we call the estimator “unbiased”
  • A biased estimator is not necessarily a bad thing
  • Sample mean is unbiased estimator
  • Sample variance is unbiased estimator
  • MOM estimator of variance = is biased
  • Asymptotically less biased as n  
  • For large n, either sample variance or MOM estimate
  • f variance is fine.

   ] ˆ [ E

n i i

X n X

1

1

  

n i i

n X X S

1 2 2

1 ) (

2

1S n n 

Estimator Consistency

  • Estimator “consistent”: for e > 0
  • As we get more data, estimate should deviate from true

value by at most a small amount

  • This is actually known as “weak” consistency
  • Note similarity to weak law of large numbers:
  • Equivalently:
  • Establishes sample mean as consistent estimate for m
  • Generally, MOM estimates are consistent

1 ) | ˆ (| lim   

 

e   P

n

) | (| lim   

 

e m X P

n

1 ) | (| lim   

 

e m X P

n

Method of Moments with Bernoulli

  • Consider I.I.D. random variables X1, X2, ..., Xn
  • Xi ~ Ber(p)
  • Estimate p
  • Can use estimate of p for X ~ Bin(n, p)
  • If you know what n is, you don’t need to estimate that

p X n X m X E p

n i i i

ˆ 1 ˆ ] [

1 1

    

slide-3
SLIDE 3

3 Method of Moments with Poisson

  • Consider I.I.D. random variables X1, X2, ..., Xn
  • Xi ~ Poi(l)
  • Estimate l
  • But note that for Poisson, l = Var(Xi) as well!
  • Could also use method of moments to estimate:
  • Usually, use first moment estimate
  • More generally, use the one that’s easiest to compute

l l ˆ 1 ˆ ] [

1 1

    

 n i i i

X n X m X E

l l ˆ ) ( ) ˆ ( ˆ ] [ ] [

1 2 2 2 1 2 2 2 1

      

 

n X X m m X E X E

n i i i

Method of Moments with Normal

  • Consider I.I.D. random variables X1, X2, ..., Xn
  • Xi ~ N(m, 2)
  • Estimate m
  • Now estimate 2

m m ˆ 1 ˆ ] [

1 1

    

 n i i i

X n X m X E

2 1 2 2

) ˆ ( ˆ m m   

n X X X n X n X n

n i i n i n i i n i i

   

   

           

1 2 2 1 2 1 2 2 1 2

) ( 1 1 ˆ 1 m

Method of Moments with Uniform

  • Consider I.I.D. random variables X1, X2, ..., Xn
  • Xi ~ Uni(a, b)
  • Estimate mean:
  • Estimate variance:
  • For Uni(a, b), know that:
  • Solve (two equations, two unknowns):
  • Set b = 2m – a, substitute into formula for 2 and solve:

m m ˆ 1 ˆ

1 1

  

 n i i

X n m

2 1 2 2 2 1 2 2

ˆ ) ( ) ˆ ( ˆ       

 

n X X m m

n i i

12 ) ( 2

2 2

a b b a      m and   ˆ 3 ˆ ˆ 3 ˆ     X b X a and