1
play

1 Another, Separate Issue: Hypocalcemia Impacts a Variety of - PDF document

Transition Cow Management and Monitoring Checklist Michael Overton, DVM, MPVM Associate Professor, Dairy Production Medicine University of Georgia, College of Veterinary Medicine moverton@UGA.edu Denise Rich therichartist.com Management


  1. Transition Cow Management and Monitoring Checklist Michael Overton, DVM, MPVM Associate Professor, Dairy Production Medicine University of Georgia, College of Veterinary Medicine moverton@UGA.edu Denise Rich – therichartist.com 
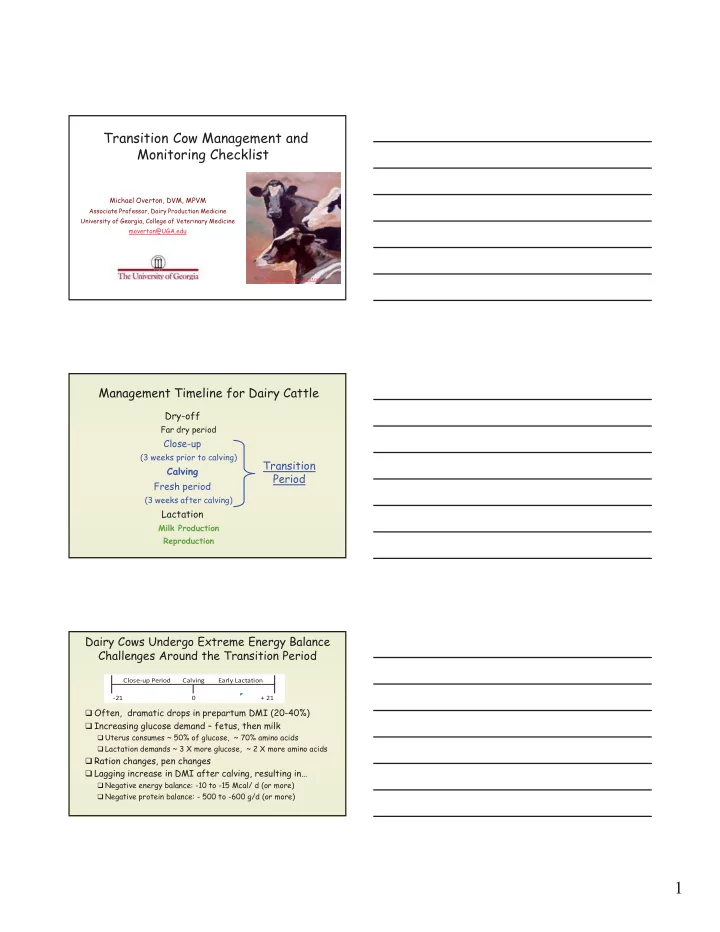
Management Timeline for Dairy Cattle Dry-off Far dry period Close-up (3 weeks prior to calving) Transition Transition Calving Period Fresh period (3 weeks after calving) Lactation Milk Production Reproduction Dairy Cows Undergo Extreme Energy Balance Challenges Around the Transition Period Close � up � Period Calving Early � Lactation � 21 0 � + � 21 � Often, dramatic drops in prepartum DMI (20-40%) � Increasing glucose demand – fetus, then milk � I i l d d f t th ilk � Uterus consumes ~ 50% of glucose, ~ 70% amino acids � Lactation demands ~ 3 X more glucose, ~ 2 X more amino acids � Ration changes, pen changes � Lagging increase in DMI after calving, resulting in… � Negative energy balance: -10 to -15 Mcal/ d (or more) � Negative protein balance: - 500 to -600 g/d (or more) 1

  2. Another, Separate Issue: Hypocalcemia Impacts a Variety of Processes in Fresh Cows � DMI of fresh cows � LDA’s, early lactation milk production � Uterine involution (i.e., may � risk of metritis) � Neutrophil function (i.e., may � risk of metritis or mastitis) mastitis) Hypocalcemia Normocalcemia Plasma Ca (d-0) 7.2 mg/ dl 8.3 mg/dl By day 21: LSCC 3.5 2.1 P < 0.05 BCS loss 0.5 0.25 P < 0.05 Clinical ketosis 49% 14% P = 0.08 W. G. Chamberlin et al., 2009 ADSA Transition Cow Checklist – Developed as an Aid/ Starting Point to Review Management � Goal – provide guidelines that would positively impact the health, productivity and profitability of transition cows � R � Rapidly increase feed intake after calving – more milk idl i f d i t k ft l i ilk � Less likely to develop fresh cow disease issues � (Metritis, ketosis, LDA, etc � Less likely to leave the herd prematurely (culled) � More likely to begin normal cyclicity sooner � Serve as an aid in the investigation of problems Key Areas on Which to Focus � Pen moves � Eliminate unnecessary moves � Avoid moving during last 10 days prior to calving � Nutritional management and access � Stocking density/ bunk space in close-up and fresh pens � Stocking density/ bunk space in close-up and fresh pens � Avoid overfeeding energy in far dry and close-ups � Pay attention to fiber intake throughout � Cow comfort � Maintain adequate, comfortable, dry area for resting � Avoid prolonged, idle standing times � How do we MONITOR to assess change? 2

  3. Grouping and Pen Movement � Goal: reduce the social, environmental and metabolic stressors by minimizing the number of pen changes and the impact of each move � Impact of pen changes – social and nutritional stress: � Maximum effect on feeding behavior is in first hour � Generally expect a 2.5-5% reduction in milk production � Social impacts lasts ~ 3 days � May impact both the new cows and the established ones (Grant and Albright, 2001; Friend et al., 1977, Albright, 1978) Grouping and Pen Movement Suggestions: � *Try to avoid moving cows during last 10 days before calving (strive for > 14 days in close-up pen) � Depending on the herd , may need to target for an avg DINCU > 23 in order to ensure most cows have adequate time in close-up In this data set: - 64% of cows spent 14 – 30 DINCU - ~ 90% spent 10 – 40 DINCU DINCU and Metabolic Disease (13,000 cows in 5 herds) 3

  4. DINCU and Peak Milk (lbs) (13,000 cows in 5 herds) DINCU DINCU DINCU DINCU = 1-7 = 8-14 = 15-21 > 21 DINCU and Reproduction - Demo � Mature cows with pDCC = 270 – 290 � Group 1 – normal DINCU (n = 927) � PR = 19% � 26,654 lbs 305me � 26 654 lbs 305me � Early culling: 7.5% (6 – 10%) � Group 2 – short DINCU (n = 122) � PR = 15% � 24,375 lbs 305me � Early culling: 10% (5 – 17%) Close-up Moving Strategies (again, varies by herd) � Most of year: � LIST ID DCC DUE FOR DCC>257 � Cows moved weekly � Expected range of 258 – 264 DCC (projected avg = 21) � Summer list: � LIST ID DCC DUE FOR DCC>250 � Cows moved weekly � Expected range of 251 – 257 DCC (projected avg = 28) 4

  5. DINCU Details for Mature Cows in Southeast Dairy MOFSH DINCU PCT= 1 - 10 Count Total 95% CI May 20 11% 6 57 5-21 Jun 19 12% 12 100 7-20 Jul 20 13% 12 96 7-21 Aug 22 4% 5 115 2-10 Sep 23 2% 2 121 0- 6 Oct 22 9% 9 100 5-16 Nov 19 12% 11 93 7-20 Dec 17 11% 12 107 7-19 Jan 18 12% 10 81 7-21 Feb 21 14% 8 56 7-26 Mar 28 3% 2 64 1-11 avg 21 9% 90 998 7-11 Grouping and Pen Movement Suggestions: � If possible, target longer DINCU for cows with twins or cows dry during summer heat stress � Decrease impact of pen changes by moving groups of 10 or more at a time � Moving in afternoon or early evening may decrease impact � Separate cows and heifers if possible � Higher resting and eating times when heifers separated (Albright, 1978) Stocking Density � Access to feed for all cows at the same time is the key as is the ability to freely rest comfortably � In 1 st lactation animals stocked at 80% of stall numbers as � In 1 st lactation animals stocked at 80% of stall numbers as compared to 120% stocking density: � ~ 33” feedbunk vs 22” in a 4-row barn � 6.5 lb per day increase in milk production over the first 80 DIM � Minimum of ~30” of bunk space is recommended for the pre- fresh group. (Dr. Ken Nordlund) 5

  6. Prepartum Stocking Density (freestalls) 1st Test Milk (Lact 2+) 100 95 (Lbs Milk) 90 85 1st Test 80 75 70 70% 80% 90% 100% 110% 120% 130% 140% 150% 160% 170% 180% 190% 200% Stocking De nsity (a t Ca lving) M. Overton and B. Sischo, unpublished work Grouping and Pen Movement Suggestions: � Strive to provide ~ 30” of bunk space per animal in close-up and fresh pens � Watch out for seasonal changes in calving patterns � Analysis of herd calving patterns (Ca, Co, NC, & Ga) Allowed Bunk Space Avg % (% of Avg # Calving) Overcrowded 100% 48% 110% 33% 120% 26% 130% 16% 140% 9% 150% 4% Nutrition and Feed Delivery � Goals: � Minimize the inevitable drop (and impact of the drop) in DMI that occurs prior to calving � Maximize rise in DMI after calving � Limit the negative impact on liver health � Limit the negative impact on liver health 50 1000 30 25 40 800 20 30 600 15 20 400 A 10 DMI (lbs) 10 200 B 5 NEFA 0 0 0 -29 -22 -15 -8 -1 6 13 20 27 � 21 � 18 � 15 � 12 � 9 � 6 � 3 0 Burhans and Bell, 1998 6

  7. Nutrition and Feed Delivery � General concepts: � Ensure adequate fiber intake (7-7.5 lbs forage ADF) � Watch sortability – Grind hays to ~ 2-3”; add water if needed � Maintain proper level of metabolizable protein & balanced sources of carbohydrates (NFC) � Target a 5% refusal (orts) or more on a daily basis � Feed increased levels of vitamin E pre- and postpartum � Limit silages to no more than 40-50% of prefresh forage Specific Additives for Consideration in Transition Nutrition � Rumensin – 400 mg/ cow/ day � Support higher propionate levels � Potential way to reduce risk for hyperketonemia y yp � ReaShure – 60 grams/ cow/ day � Improve liver health via increasing synthesis and secretion of VLDL’s � Both should be fed throughout close-up and fresh period Housing Keys � Provide clean, dry, comfortable housing � Mud or heat stress increases maintenance needs but decreases DMI � Wet, mucky conditions increase risk of mastitis and metritis � Housing options: � 1 comfortable, easy-to-use sand-bedded stall per cow or � 100 sq ft of bedded pack per cow or � 500-600 sq. ft. loafing area + 50-70 sq ft. shade per cow in dry lot dairies � Minimize walking distances (to/ from parlor for fresh cows) � Minimize lock-up time and time away from pen (holding pen/ milking for fresh cows) 7

  8. Maternity Management � Individual calving pens can be great, but be careful � Ideally, cows… � Are moved in a stress-free manner during early labor � Are maintained in an individual maternity pen/ stall only long enough to calve � Avoid “solitary confinement” � Practice good sanitation Time Mis-Management (Cow’s Perspective) Milking time 2-3 hrs (5) Eating/ Drinking 5-6 hrs (4) Socialization/ walking 2-3 hrs (2) Standing in stalls 1-2 hrs (1) Forced lockup < 1 hr (2) L i Lying 12 14 h 12-14 hrs (10) (10) 24 � Consider: Milking � -2 or -8 lb milk loss Eating � Extra 0.25 to 0.75 Socializing BCS loss over 100 days Standing Lying (Adapted from Rick Grant) Monitoring � Traditionally, we have focused on measuring results (outcomes) � Focus needs to shift toward monitoring processes � Dry matter intake – pre and post-partum � Urine pH � Stocking density � DINCU � Cow comfort potential 8

Download Presentation
Download Policy: The content available on the website is offered to you 'AS IS' for your personal information and use only. It cannot be commercialized, licensed, or distributed on other websites without prior consent from the author. To download a presentation, simply click this link. If you encounter any difficulties during the download process, it's possible that the publisher has removed the file from their server.

Recommend


More recommend