
SLIDE 1
Inferences for Ratios of Normal Means
(mratios package)
- G. Dilba, F. Schaarschmidt, L. A. Hothorn
Institute of Biostatistics, University of Hannover UseR! Conference Wien, 15 June 2006
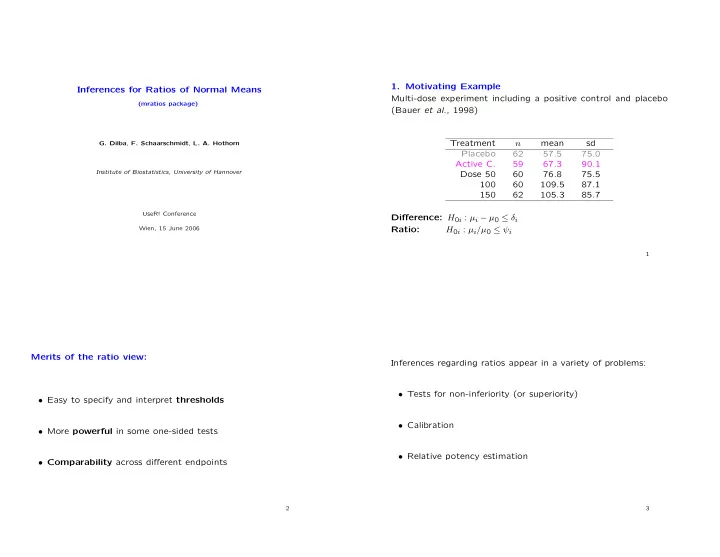
- 1. Motivating Example
Multi-dose experiment including a positive control and placebo (Bauer et al., 1998) Treatment n mean sd Placebo 62 57.5 75.0 Active C. 59 67.3 90.1 Dose 50 60 76.8 75.5 100 60 109.5 87.1 150 62 105.3 85.7 Difference: H0i : µi − µ0 ≤ δi Ratio: H0i : µi/µ0 ≤ ψi
1
Merits of the ratio view:
- Easy to specify and interpret thresholds
- More powerful in some one-sided tests
- Comparability across different endpoints
2
Inferences regarding ratios appear in a variety of problems:
- Tests for non-inferiority (or superiority)
- Calibration
- Relative potency estimation
3