
SLIDE 1
1
1 3 Disclaimer Certain statements in this communication may be - - PowerPoint PPT Presentation
1 3 Disclaimer Certain statements in this communication may be forward looking statements within the meaning of applicable laws and regulations. These forward-looking statements involve a number of risks, uncertainties and other factors
1
3
Disclaimer
Certain statements in this communication may be ‘forward looking statements’ within the meaning of applicable laws and regulations. These forward-looking statements involve a number of risks, uncertainties and other factors that could cause actual results to differ materially from those suggested by the forward looking statements. Important developments that could affect the Company’s operations include changes in the industry structure, significant changes in political and economic environment in India and overseas, tax laws, import duties, litigation and labour relations. Prince Pipes and Fittings Limited (PPFL) will not be in any way responsible for any action taken based
to reflect subsequent events or circumstances.
4
Index
Industry Overview About Us Key Strengths Leadership Profile Financials Outlook
5
Industry Overview
110 65 45 33 11 US Europe China Brazil India
(In Kg)
World Avg. 30
180 205 225 250 270 ~300 550
FY14 FY15 FY16 FY17 FY18 FY19 FY24P
(Rs. bn)
Domestic Plastic Pipes & Fittings Market Size India’s low Per Capita Plastic Consumption vs World Avg.
Source: CRISIL Research 6
Types of Polymers & Applications
7
Multiple Growth Drivers Substitution Demand from Metal Pipes
superior advantages over metal pipes Replacement demand of older pipes with plastic pipes
8
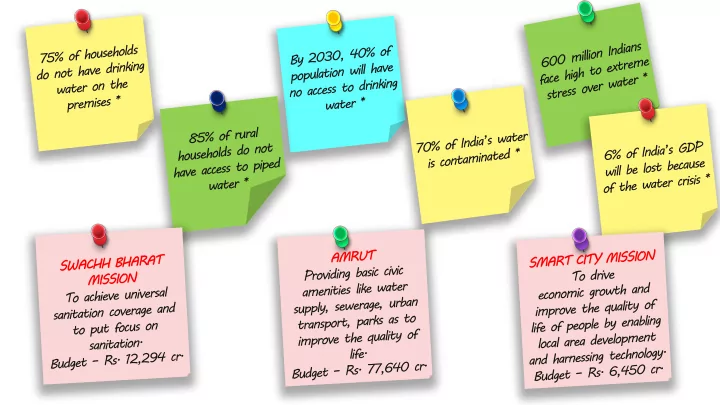
Government Initiatives
’Nal se Jal’ scheme to offer piped water to every rural house by 2024 Set up of Jal Shakti Ministry
Real Estate
Urbanisation (Traction in tier II & III cities) Smart Cities Mission and Affordable Housing
Irrigation
Irrigation Investment to grow at 10%-11% (FY18-FY23) Fiscal 2018 Budget increased allocation to PMKSY
Big getting Bigger
Note: P1 to P3 represents our Peers Source: Annual Reports 9
GST, Demonetisation BIS Strict implementation of Quality norms
Demonstrated ability to grow with an expanding market share over last 7 Years Scaling up of manufacturing footprints with two additional greenfield plants Pan India manufacturing and distribution network focusing on Service + Scale + Range Building a strong brand equity and positioning by consciously investing into brand building through various ATL, digital, BTL initiatives
Prince Pipes is amongst the Front Runner Beneficiary
Multiple Fringe National & Regional players facing major balance sheet constraints Major market share up for grabs Unorganised
Organised
Government Initiatives like
13.1% 13.3% 16.5% 17.3% P2 P1 PRINCE P3 Value terms (Rs. in Crs.)
PRINCE gains market share over the last 7 years compared to its peers
About Us
Promoted by Chheda Family Amongst Top 5 Processor in Piping Industry More than 3 decades of Operations Largest Range of SKU’s Strategic located Manufacturing units Over 3 decades of experience in manufacturing multi polymer piping systems UPVC, CPVC, PPR and HDPE polymers being processed across our 6 manufacturing facilities Products sold through our 2 brands Prince and Trubore A wide range of 7,167 SKU’s finding application across Plumbing, Sewage, Irrigation, Industrial and Underground Drainage Pan India distribution network
1,408 Channel Partners Further more we have 11 warehouses to focus on efficient supply & timely service 6 State of the Art Manufacturing facilities located at Haridwar, Jaipur, Athal, Dadra, Chennai, Kolhapur Our 7th State of the Art plant to come up in Telangana from IPO proceeds Industry’s Most Trusted Brand
10
Strategic Distribution & Factory Network
11
Manufacturing Plants Depots Channel Partners Upcoming Plant
principal markets to improve cost efficiencies Strategic Manufacturing locations Pan India
Unique outsourcing Strategy for East India
Our Journey
12
Continuous Innovation through Thought Leadership
13
Sustained Thought Leadership and Execution Capabilities
14
Quality & Reliability – Our Cornerstones
15
Scaling through Jaipur Plant
16
northern India
service
Installed Capacity
Scaling through Telangana Plant
2012 Acquired Chennai & Kolhapur from Chemplast Sanmar Inorganic growth strategy for South India 2020 Way Forward Organic & Integrated Strategy Upcoming integrated manufacturing Pipe and Fitting facility in Telangana To bolster our endeavour in scaling up our distribution reach and market penetration in Southern India
Expected Installed Capacity*
Strategically located in the southern market with easy availability of skilled manpower, progressive well managed state, ease of doing business, excellent infrastructure Government projects like, affordable housing and water for all an added advantage Larger tracts of land being brought under irrigation
Key Advantages
17 Note: *In next 2-3 year horizon
Brand Play - Winning In Many Indias
18
19
20
21
IV.Pan India-Influencer & Channel Engagement Activities
22
Pan India Presence and Strategy
SOUTH NORTH EAST WEST
with Haridwar plant
equity in North
growth
through
plant and Trubore brand
integrated plant in Telangana
different states to capture rapid urbanization for efficient supply & Service
35.8% 33.9% 24.7% 5.7%
NORTH SOUTH WEST EAST
FY15 Sales Profile Geographical spread
38.6% 26.9% 23.5% 11.0%
NORTH SOUTH WEST EAST
FY19 Sales Profile Geographical spread
Channel Partners
23 Key Strengths
Multi Polymer Product Basket
24 Key Strengths
Wide Range of Pipes & Fittings SKUs
Note: P1 to P3 represents our Peers Source: Annual Reports 8,085 1,600 7,167 7,000 P1 P2 PRINCE P3
Market share gain on multi pronged growth approach Market share gain in Volume terms
To outpace the industry growth by at least 2-4%
Over the medium term thru multi- location strategy
Multi-product and multi-brand approach
Approach
38.0% 37.3% 35.5% 36.1% 34.6% 33.2% 34.9% 34.0% 14.6% 15.3% 15.2% 16.7% 12.9% 14.2% 14.4% 13.2% 0% 10% 20% 30% 40% 50% 60% 70% 80% 90% 100% FY16 FY17 FY18 FY19
Chart Title
P1 P2 PRINCE P3 * Assuming Top 4 Players as Market Universe
PRINCE PIPES INCREASING MARKET SHARE v/s PEERS SET
FY16 FY19
25 Key Strengths Note: P1 to P3 represents our Peers Source: Annual Reports
Execution capability with thrust on margin
Margin Levers
Margin gains due to product mix change
Higher growth in Plumbing and Drainage Segment v/s Rest of the Portfolio
34.6% 35.4% 33.7% 31.3% 64.4% 63.5% 65.0% 65.5% 1.0% 1.1% 1.3% 3.2% FY16 FY17 FY18 FY19 Agri Plumbing + SWR Others (incl. DWC)
…..due to improvement in product-mix with rising share of Plumbing/SWR pipes
Key Strengths 26 Note: P1 to P3 represents our Peers Source: Annual Reports
Brand Monetization Favorable Operating Leverage due to volume growth Product Mix Improvement
Improvement of cash conversion cycle
87 68 66 59 37 FY16 FY17 FY18 FY19 9MFY20 36 50 67 47 74 FY16 FY17 FY18 FY19 9MFY20 49 42 78 70 60 FY16 FY17 FY18 FY19 9MFY20 74 77 55 36 51 FY16 FY17 FY18 FY19 9MFY20
Debtor Days Inventory Days Creditor Days Working Capital Days
27 Key Strengths
Board of Directors
Directors Work Experience
Executive Director
associate degree in business administration from Oakland Community College
Award – 2016’ at the Economic Times Summit
Background
Founder, Chairman and MD
incorporation
the Vinyl India Conference, 2014
Executive Director
Rajesh R. Pai Nominee Director MD & Founder of GEF Capital Partners
investing growth and expansion stage capital in the US
Management System, British Telecom and AT&T
28
Independent Directors
Directors Work Experience Directorship & Past Affiliation
Independent Director
Chartered Accountant
Independent Director
Chartered Accountant
Background
Additional Independent Director
experience in industry and professional coaching to executives
Independent Director
experience in industry and consulting 29 KEC INTERNATIONAL LTD., PARAG MILK FOODS LTD., RR GLOBAL ALLCARGO LOGISTICS LTD., NAVNEET EDUCATION LTD., ZEE MEDIA CORPORATION LTD., FINOLEX INDUSTRIES LTD.,
Strong Core Professional Team
CXO Work Experience Past Affiliations
Chief Operations Officer Age : 41 Years; Exp. : 15+ Years
University
GM – Marketing & New Product Development Age : 61 Years; Exp. : 35+ Years
Background
Chief Financial Officer Age : 48 Years; Exp. : 22+ Years
ICAI
Vice President– Sales & Marketing - Prince Age : 53 Years; Exp. 30+ years
National Head Sales & Marketing - Trubore Age : 43 Years; Exp. : 21+ Years
Vice President & Chief Human Resources Officer Age : 51 Years; Exp. : 30+ Years
Welfare – Siber Kolhapur
30 UNITED PHOSPHOROUS LTD, S. KUMARS LTD., HINDUSTAN UNILEVER LTD., VOLVO EICHER JAQAUR P. LTD., PIDILITE INDUSTRIES LTD. PIDILITE INDUSTRIES LTD., ASIAN PAINTS LTD., GODREJ & BOYCE TBZ LTD., BHARAT GEARS LTD.
Key Highlights 9M FY20
tax at reduced rates
to 25.168%
31
Financial Matrix - P&L 9M FY20
Particulars 9M FY20 9M FY19 Growth % Y-O-Y Revenue from Operation 1204.9 1072.9 12% EBIDTA 171.1 125.8 36% EBITDA % 14.2% 11.7% 248 bps Other Income 1.8 5.2
Depreciation 37.6 32.2 17% Finance Cost 25.0 27.4
PBT 110.4 71.4 55% PBT % 9.2% 6.7% 251 bps TAX 26.1 19.1 37% PAT 84.2 52.2 61%
32
Financial Matrix - P&L Q3 FY20
Particulars Q3 FY20 Q3 FY19 Growth % Y-O-Y Revenue from Operation 395.9 361.0 10% EBIDTA 53.3 43.2 23% EBITDA % 13.5% 12.0% 150 bps Other Income 0.8 4.0
Depreciation 13.3 10.9 22% Finance Cost 8.9 9.2
PBT 31.9 27.1 18% PBT % 8.1% 7.5% 54 bps TAX 7.6 9.9
PAT 24.3 17.2 41%
33
Key Balance Sheet Details
34
Key Balance Sheet Details (Rs. In crore) 31-Dec-19 30-Sep-19 31-Mar-19 Net worth 821.7 459.5 398.9 Long Term Debt (Including Current Maturity) 108.3 150.7 151.2 Short Term Debt 194.4 171.7 145.7 Total debt 302.7 322.4 296.9 Cash and cash equivalents 79.0 7.9 8.9 Other Balances with banks 237.5 16.0 13.4 Fixed Assets(including CWIP) 486.2 463.3 424.9 Receivables 162.3 166.2 250.4 Payables 180.2 197.1 215.2 Inventories 324.3 288.2 201.1
Q3 & 9M FY20 Financial Highlights
361 396 Q3 FY19 Q3 FY20 Revenue (₹ in Crs.)
29,617 31,122
Q3 FY19 Q3 FY20
Q3
43 53 Q3 FY19 FY20
Q3
17 24 Q3 FY19 Q3 FY20
Q3
Sales Volume (MT) EBITDA (₹ in Crs.) PAT (₹ in Crs.)
Q3 FY20 Q3 FY19
35
5% 1,073 1,205 9M FY19 9M FY20 Revenue (₹ in Crs.)
89,533 99,676
9M FY19 9M FY20 126 171 9M FY19 9M FY20 52 84 9M FY19 9M FY20 Sales Volume (MT) EBITDA (₹ in Crs.) PAT (₹ in Crs.)
Q3 FY20 Q3 FY19 9M FY20 9M FY19 9M FY20 9M FY19
29 74 74 82 84
FY16 FY17 FY18 FY19 9M FY20 FY16 FY17 FY18 FY19 9M FY20
Financial Track Record
288 310 355 275 184 243 318 399
FY16 FY17 FY18 FY19
Net Debt Net Worth
Net Debt & Net Worth
4.0x 4.4x 3.7x 4.3x
3.2 3.4 3.6 3.8 4.0 4.2 4.4 4.6FY16 FY17 FY18 FY19
Net Fixed Assets Turnover Ratio (x)
17.4% 34.5% 26.4% 23.0% 15.1% 25.2% 20.3% 20.9%
0.05 0.1 0.15 0.2 0.25 0.3 0.35 0.4FY16 FY17 FY18 FY19
RoE RoCE
Net Fixed Assets Turnover Ratio (x) RoE% & RoCE%
1,007 1,247 1,315 1,561 1,202
FY16 FY17 FY18 FY19 9M FY20 FY16 FY17 FY18 FY19 9M FY20
Net Revenue from Products
98 161 162 184 171
20 40 60 80 100 120 140 160 180 200FY16 FY17 FY18 FY19 9M FY20 FY16 FY17 FY18 FY19 9M FY20
EBITDA & EBITDA Margin PAT & PAT Margin
2.9% 5.9% 5.6% 7.0% 1.6 1.3 1.1 0.7 9.7% 12.9% 12.3% 11.8%
₹ in Crs.
Margin Margin Margin 36
14.2% 5.3%
Contact Details:
37
VP & Group CFO :cfo@princepipes.com
Investor Relations : investor@princepipes.com