1 2 3 4 5 6 REVISION BLOCK REV DESCRIPTION DATE INCORP. BY - - PowerPoint PPT Presentation

1 2 3 4 5 6
SMART_READER_LITE
LIVE PREVIEW

1 2 3 4 5 6 REVISION BLOCK REV DESCRIPTION DATE INCORP. BY - - PowerPoint PPT Presentation

1 2 3 4 5 6 REVISION BLOCK REV DESCRIPTION DATE INCORP. BY Background - 12/10/07 EAW Initial Release This document compares the TCS1 actual operation with the SIMULINK model as of December 2007. Tracking, offset, and slew


slide-1
SLIDE 1

A B C D A B C D 1 2 3 4 5 6 1 2 3 4 5 6

FILE: Z:\public_html\Presentation\TCS1 Model vs Actual 12_07_07.vsd

TCS1 Model vs. Actual

University of Hawaii

I nstitute fo r Astro no my

TCS1-MvA

TITLE DWG #

  • REV

ENGINEER

  • E. Warmbier

LAST EDIT 12/13/2007 4:11:11 PM SHEET

1 of 13

SIZE B REVISION BLOCK REV DESCRIPTION DATE

  • INCORP. BY

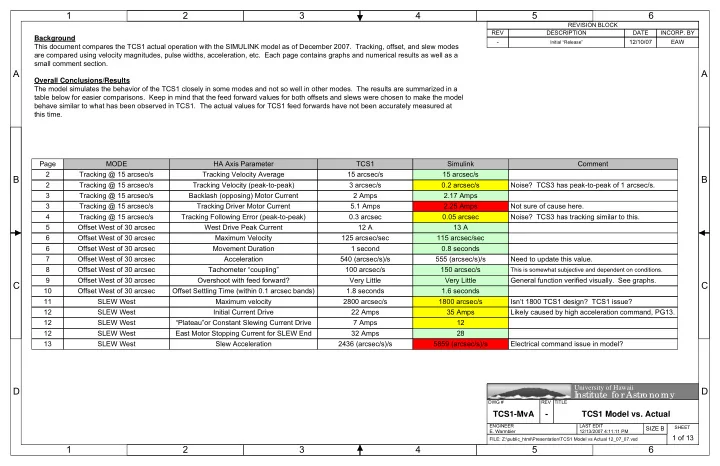
Background This document compares the TCS1 actual operation with the SIMULINK model as of December 2007. Tracking, offset, and slew modes are compared using velocity magnitudes, pulse widths, acceleration, etc. Each page contains graphs and numerical results as well as a small comment section. Overall Conclusions/Results The model simulates the behavior of the TCS1 closely in some modes and not so well in other modes. The results are summarized in a table below for easier comparisons. Keep in mind that the feed forward values for both offsets and slews were chosen to make the model behave similar to what has been observed in TCS1. The actual values for TCS1 feed forwards have not been accurately measured at this time. HA Axis Parameter TCS1 Simulink Comment Page 2 Tracking Velocity Average 2 Tracking Velocity (peak-to-peak) 15 arcsec/s 15 arcsec/s 0.2 arcsec/s 3 arcsec/s Noise? TCS3 has peak-to-peak of 1 arcsec/s. 3 Backlash (opposing) Motor Current 2 Amps 3 Tracking Driver Motor Current 5.1 Amps 2.17 Amps 2.25 Amps Not sure of cause here. 4 Tracking Following Error (peak-to-peak) 13 A 0.05 arcsec Noise? TCS3 has tracking similar to this. MODE Tracking @ 15 arcsec/s Tracking @ 15 arcsec/s Tracking @ 15 arcsec/s Tracking @ 15 arcsec/s Tracking @ 15 arcsec/s 5 Offset West of 30 arcsec West Drive Peak Current 12 A 6 Offset West of 30 arcsec Maximum Velocity 125 arcsec/sec 115 arcsec/sec 6 Offset West of 30 arcsec Movement Duration 1 second 0.8 seconds 7 Offset West of 30 arcsec Acceleration 540 (arcsec/s)/s 555 (arcsec/s)/s Need to update this value. 8 Offset West of 30 arcsec Tachometer “coupling” 100 arcsec/s 150 arcsec/s

This is somewhat subjective and dependent on conditions.

9 Offset West of 30 arcsec Overshoot with feed forward? Very Little Very Little General function verified visually. See graphs. 10 Offset West of 30 arcsec Offset Settling Time (within 0.1 arcsec bands) 1.8 seconds 1.6 seconds 11 SLEW West Maximum velocity 2800 arcsec/s 1800 arcsec/s Isn’t 1800 TCS1 design? TCS1 issue? 12 SLEW West Initial Current Drive 22 Amps 35 Amps Likely caused by high acceleration command, PG13. 0.3 arcsec 12 SLEW West “Plateau”or Constant Slewing Current Drive 7 Amps 12 12 SLEW West East Motor Stopping Current for SLEW End 32 Amps 28 13 SLEW West Slew Acceleration 2436 (arcsec/s)/s 5859 (arcsec/s)/s Electrical command issue in model?

Initial “Release”

  • 12/10/07

EAW

slide-2
SLIDE 2

A B C D A B C D 1 2 3 4 5 6 1 2 3 4 5 6

TCS1-MvA

DWG #

  • REV

SHEET

2 of 13

TRACKING @ 15 Arcsec/sec SIMULINK TCS1 12/6/07 SIMULINK TCS1 12/6/07 SIMULINK TCS1 12/6/07

RESULTS / COMMENTS The model tracks at 15 Arcsec/sec just like the actual TCS1. However, the model has a peak-to-peak of less than 0.2 Arcsec/sec. The actual TCS1 has a peak-to-peak of about 3 Arcsec/sec. The model has large deviations in velocity on the tachometers, but it is filtered out though the tachometer summer and filter board. Possible explanations are: 1) Frequency content or noise amplitude of actual tachometers is higher.

Actual TCS1 Data (compare with “average”)

slide-3
SLIDE 3

A B C D A B C D 1 2 3 4 5 6 1 2 3 4 5 6

TCS1-MvA

DWG #

  • REV

SHEET

3 of 13

SIZE

B TRACKING @ 15 Arcsec/sec Actual TCS1 Data SIMULINK TCS1 12/6/07 SIMULINK TCS1 12/6/07

RESULTS / COMMENTS The model does not require a large a large current differential between the motors for tracking. In absolute terms, about 100 mV of difference between the two motors is shown. In actual operation, there is a difference of 3 amps. Possible explanations are: 1) Friction of some sort is too low in the model.

slide-4
SLIDE 4

A B C D A B C D 1 2 3 4 5 6 1 2 3 4 5 6

TCS1-MvA

DWG #

  • REV

SHEET

4 of 13

SIZE

B TRACKING @ 15 Arcsec/sec

RESULTS / COMMENTS The model has a better following error 0.05 Arcsec peak-to-peak vs. 0.3 Arcsec peak-to- peak for TCS1. Perhaps noise is present in actual tachs?

Actual TCS1 Data SIMULINK TCS1 12/6/07

slide-5
SLIDE 5

A B C D A B C D 1 2 3 4 5 6 1 2 3 4 5 6

TCS1-MvA

DWG #

  • REV

SHEET

5 of 13

SIZE

B TRACKING @ 15 Arcsec/sec then OFFSET 30 Arcsec SIMULINK TCS1 12/6/07 SIMULINK TCS1 12/6/07 Actual TCS1 Data

RESULTS / COMMENTS As noted earlier the tracking current is very low in the model. The magnitude of the current to drive the offset seems to be approximately equal in the SIMULINK (~13 A) model and TCS1 (~ 12 A) although the SIMULINK model has a slight

  • vershoot as is seen by the small EAST current “bump”.
slide-6
SLIDE 6

A B C D A B C D 1 2 3 4 5 6 1 2 3 4 5 6

TCS1-MvA

DWG #

  • REV

SHEET

6 of 13

SIZE

B TRACKING @ 15 Arcsec/sec then OFFSET 30 Arcsec

1 second RESULTS / COMMENTS The SIMULINK and TCS1 models appear to very close in magnitude. The SIMULINK model appears to reach a peak velocity of 115 Arcsec/sec and the TCS1 reaches about 125 Arcsec/sec. The movement time seems to be slightly longer for the actual TCS1, however, it is hard to determine precisely looking at these graphs with the present

  • scaling. Approximately, the TCS1 appears to have

a one second duration while the SIMULINK model has a 0.8 second duration.

Actual TCS1 Data (compare with “average”) SIMULINK TCS1 12/6/07 (feed forward = 0.6 ms)

~0.8 sec

slide-7
SLIDE 7

A B C D A B C D 1 2 3 4 5 6 1 2 3 4 5 6

TCS1-MvA

DWG #

  • REV

SHEET

7 of 13

SIZE

B

HA 30 arcsec Offset Data from 10/11/07 y = 539.61x - 10218 R2 = 0.9549 20 40 60 80 100 120 140 160 18.9 18.95 19 19.05 19.1 19.15 19.2 19.25 19.3 Time (sec) Velocity (arcsec/s)

TRACKING @ 15 Arcsec/sec then OFFSET 30 Arcsec

Δx=0.8437" Δy=1.2187" Slope=1.44 Δx=0.2 sec Δy=20 as/s Slope=100 (as/s)/s 1.44*x=100 X=69.44 (as/s)/s (conversion)

SIMULINK TCS1 12/10/07, (offset feed forward = 0.7ms)

Δx=0.625 Δy=5 Slope=8 Converted 8*69.44=555 (as/s)/s RESULTS / COMMENTS The SIMULINK model and TCS1 appear to very close in offset velocity magnitude with 540 arcsec/s (TCS1) vs 555 arcsec/s (SIMULINK).

Actual TCS1 Data from 10/11/07

slide-8
SLIDE 8

A B C D A B C D 1 2 3 4 5 6 1 2 3 4 5 6

TCS1-MvA

DWG #

  • REV

SHEET

8 of 13

SIZE

B

RESULTS / COMMENTS Originally is was observed that the SIMULINK tachometers seemed to be less coupled to each other (through the bull gear) than the TCS1

  • tachometers. The difference in tachometer readings reach a maximum
  • f nearly 150 arcsec/sec in the simulink model. In the TCS3 data

logged graph above, the tachometers seem to follow each other fairly closely (within 25 arcsec/sec or 0.05V). However, there is a region (red dotted oval) where the tachometer difference is larger, somewhere

  • n the order of 100 arcsec/sec. Notice the drive currents abruptly

changed in this area creating torque in the opposite directly rapidly. Therefore, the model may be correct in this respect. Less coupled tachometers would be a worse case scenario which makes it acceptable for the model (as opposed to perfectly coupled tachometers with respect to each other).

TRACKING @ 15 Arcsec/sec then OFFSET 30 Arcsec SIMULINK TCS1 12/6/07, (offset feed forward = 0.6ms) Actual TCS3 Data (from data logger & safety board)

Tachometer scaling is approximately (500 arcsec/sec) per volt. For reference, 150 arcsec/sec is 0.3V.

slide-9
SLIDE 9

A B C D A B C D 1 2 3 4 5 6 1 2 3 4 5 6

TCS1-MvA

DWG #

  • REV

SHEET

9 of 13

SIZE

B TRACKING @ 15 Arcsec/sec then OFFSET 30 Arcsec SIMULINK TCS1 12/6/07 SIMULINK TCS1 12/7/07 (NO OFFSET FEED FORWARD)

RESULTS / COMMENTS The resolution on the graphs is coarse, however, notice the effect of the offset feed forward on the

  • vershoot.
slide-10
SLIDE 10

A B C D A B C D 1 2 3 4 5 6 1 2 3 4 5 6

TCS1-MvA

DWG #

  • REV

SHEET

10 of 13

SIZE

B

TCS1 Positions

67600 67620 67640 67660 67680 67700 67720 67740 18.8 19.8 20.8 21.8 22.8 23.8 24.8 Time (seconds) Position (arcsec) Pos (arcsec) Desired

TCS1 HA Following Error

  • 0.2
  • 0.15
  • 0.1
  • 0.05

0.05 0.1 0.15 0.2 18.8 19.8 20.8 21.8 22.8 23.8 24.8 Time (sec) Following Error (arcsec)

~1.8 seconds

TRACKING @ 15 Arcsec/sec then OFFSET 30 Arcsec

Actual TCS1 Data 10/11/07 Actual TCS1 Data 10/11/07 SIMULINK, “Offset FeedForward=0.7ms”, 12/07/07 ~1.6 seconds

NOTE: Desired was created in Excel, so it is a very close approximation.

RESULTS / COMMENTS The SIMULINK and TCS1 models appear to behave similarly. Settling times are approximately equal (1.8s vs 1.6s). However, keep in mind that the offset feed forward has not been well characterized and therefore the value currently used in the SIMULINK model was set to match what has been observed with TCS1 operation in terms of current drive, settling, etc.

slide-11
SLIDE 11

A B C D A B C D 1 2 3 4 5 6 1 2 3 4 5 6

TCS1-MvA

DWG #

  • REV

SHEET

11 of 13

SIZE

B SLEWING 1500 arcsec

Actual TCS1 Data 10/11/07 SIMULINK, “SLEW switch = 250 arcsec”, 12/07/07 RESULTS / COMMENTS The SLEW maximum velocity is much higher in the actual TCS1 than the SIMULINK model. It is though or “known” that the TCS wasn’t supposed to go much faster than 1800 arcsec/sec. It seems that it goes much faster than that at around a maximum of ~2800 arcsec/sec. Also, the variable in the model that determines when the SLEW mode re-enters normal mode is 250 arcseconds from the desired end position. It isn’t known what value the actual system uses at the moment. 250 was chosen because it gives a reasonable response in the model.

slide-12
SLIDE 12

A B C D A B C D 1 2 3 4 5 6 1 2 3 4 5 6

TCS1-MvA

DWG #

  • REV

SHEET

12 of 13

SIZE

B SLEWING 1500 arcsec

RESULTS / COMMENTS The TCS1 SLEW waveform shape is similar. It has a large current pulse to initiate movement followed by a plateau once it is moving and then an

  • scillation between the two motors to bring the

telescope to a rest, which is an overshoot. The SIMULINK model does not exhibit large or multiple

  • scillations when coming to a stop.

The amplitudes of the currents for the motors are quite different. The initial pulse is ~22A followed by a plateau of ~7A for the TCS1. The reverse pulse is ~32A. The SIMULINK model has an initial pulse

  • f ~35A, followed by a plateau of ~12A and a

reverse pulse of 28A. The current required for the SIMULINK model is higher. The high initial current drive can be explained by the higher acceleration

  • bserved in the model. See slew acceleration

section.

slide-13
SLIDE 13

TCS1 HA Velocity (arcsec/s) Data from 10/11/07

y = 2435.8078x - 46553.8104 R2 = 0.9999

  • 1000
  • 500

500 1000 1500 2000 2500 3000 18 18.5 19 19.5 20 20.5 21 21.5 22 Time (sec) Velocity (arcsec/s)

A B C D A B C D 1 2 3 4 5 6 1 2 3 4 5 6

TCS1-MvA

DWG #

  • REV

SHEET

13 of 13

SIZE

B SLEWING 1500 arcsec

Δx=0.7188" Δy=1.4375" Slope=2 Δx=0.1 sec Δy=500 as/s Slope=5000 (as/s)/s 2*x=5000 X=2500 (as/s)/s (conversion) Δx=1.4375 Δy=3.375 Slope=2.438 Converted 2.438*2500=5869 (as/s)/s RESULTS / COMMENTS The SIMULINK model has an acceleration that is (5869/2436) 2.41 times that of the actual TCS1. This could be an electrical control issue since there is a velocity command generated and a velocity loop to drive the motors to that desired velocity. This could explain the higher current used to initially drive the motors in the SIMULINK model during a SLEW. The SIMULINK tool has a basic, somewhat crude graphing system. Therefore, slope has to be derived off the graph. In this case, the blue line determines the slope to (as/s)/s conversion.