Year End 2013/14 Overview and Scrutiny Management Committee 10 th - - PDF document

year end 2013 14 overview and scrutiny management
SMART_READER_LITE
LIVE PREVIEW

Year End 2013/14 Overview and Scrutiny Management Committee 10 th - - PDF document

12/06/14 Overview of Corporate Performance Year End 2013/14 Overview and Scrutiny Management Committee 10 th June 2014 Monitoring & Reporting Framework Council Strategy Core Dataset ,Corporate Portfolio & Corporate Risk Register


slide-1
SLIDE 1

12/06/14 1

Overview of Corporate Performance

Year End 2013/14

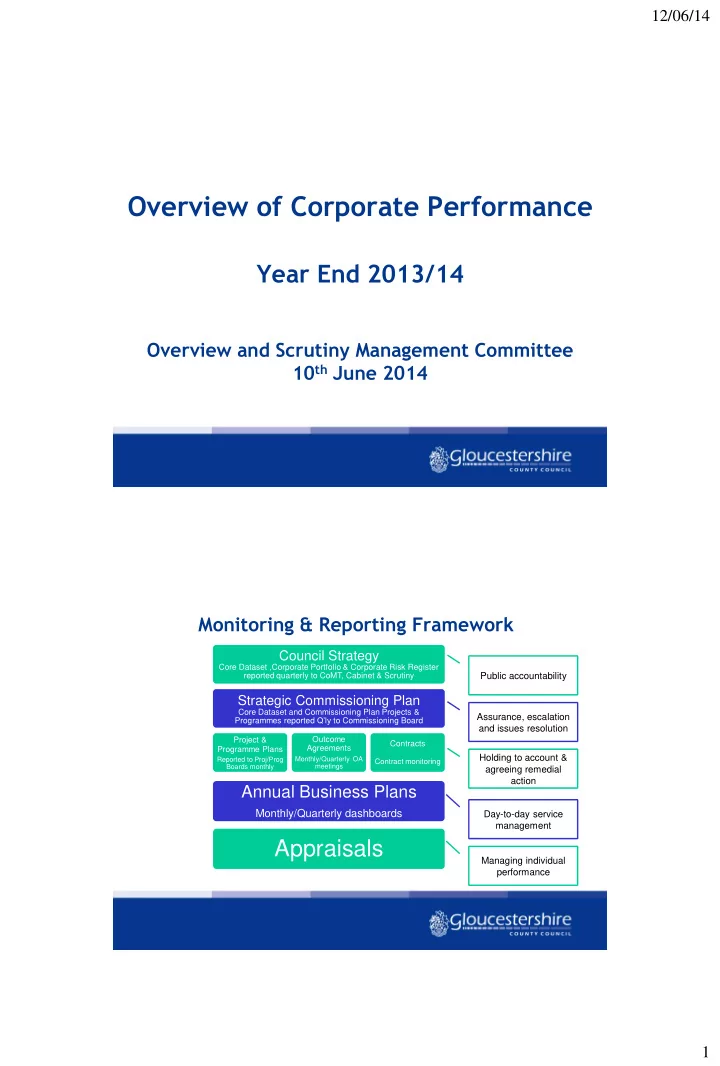
Overview and Scrutiny Management Committee 10th June 2014 Monitoring & Reporting Framework

Day-to-day service management Holding to account & agreeing remedial action

Council Strategy

Core Dataset ,Corporate Portfolio & Corporate Risk Register reported quarterly to CoMT, Cabinet & Scrutiny

Strategic Commissioning Plan

Core Dataset and Commissioning Plan Projects & Programmes reported Q’ly to Commissioning Board Project & Programme Plans

Reported to Proj/Prog Boards monthly

Outcome Agreements

Monthly/Quarterly OA meetings

Contracts Contract monitoring

Annual Business Plans

Monthly/Quarterly dashboards

Appraisals

Assurance, escalation and issues resolution Public accountability Managing individual performance

slide-2
SLIDE 2

12/06/14 2

Integrated Corporate Performance Reporting

Strategic Corporate Reporting

Core dataset of performance Indicators Contract & service performance indicators Projects & programmes National benchmarks Customer feedback Strategic & service risks Financial

  • ut-turn

‘Soft’ intelligence

We have met 60% of the ambitious targets we set

  • urselves at the start of the year

2 4 6 8 10 12 14

Number of Indicators

Ahead of Target On Target Behind Target

slide-3
SLIDE 3

12/06/14 3 Children's Pathway Flow – New In-Year Demand 2013/14

Contacts - 18,636

28.2%

Referrals - 5,262

93.4%

Initial Assessments - 4,915

21.8%

Safeguarding investigations – 1,072

56.3%

Child Protection Plan - 604

39.1%

Children in Care - 236

Figures for April 2013 - March 2014

Common Assessments (CAF) - 561 Children in Need – 2,001

We are working to balance timeliness of assessment with quality of service

A new single assessment is being introduced which will shift the focus to quality of assessment rather than speed. The current timescale for completing an initial assessment is 10 working days and 35 working days for a core assessment.

  • No. In brackets represent the

actual no. of assessments

(Higher is better)

50.0% 55.0% 60.0% 65.0% 70.0% 75.0% 80.0% 85.0% 2011/12 2012/13 Jun-13 Sep-13 Dec-13 Mar-13 %

% of assessments completed within timescales

Core Assessment Initial Assessment (827) (973) (801) (915) (421) (361) (424) (509)

slide-4
SLIDE 4

12/06/14 4

Child Protection

The rate of children subject to a child protection plan has slightly improved compared to March 2013. There has been an increase in the number of repeat plans this quarter and we remain higher than

  • ur statistical

neighbours.

  • No. In brackets represent

actual no. of children

(Lower is better)

35.5 38.3 38.9 35.1 35.4 29.7 37.9 20 25 30 35 40 Mar-13 Jun-13 Sep-13 Dec-13 Mar-14 Rate per 10,000 children

Rate of children subject to a Child Protection Plan

Rate of CP Plan Statistical Neighbour National (439) (437) (433) (480) (473) 15.3% 16.4% 20.0% 16.7% 19.0% 7.4% 7.5% 6.9% 7.1% 10.8% 16.1% 0% 5% 10% 15% 20% 25% Mar-13 Jun-13 Sep-13 Dec-13 Mar-14 %

% of children becoming subject to a child protection plan for a second or subsequent time

NI65 - % becoming subject to a CP Plan for second or subsequent time % becoming subject to a CP Plan for second or subsequent time within two years NI65 - Statistical Neighbour (34) (16) (36) (31) (23) (9) (23) (12)

Children in Care

As at the end of March there were 491 Children in Care in Gloucestershire. Numbers are starting to reduce following the increase in 2012/13.

40 39 38 42 40 43 43 40 45 30 32 34 36 38 40 42 44 46 48 50 2009/10 2010/11 2011/12 2012/13 2013/14 Rate per 10,000 Children

Rate of Children in Care

(per 10,000 children aged 0-17 years)

Gloucestershire Stat Neighbours (461) (483) (491) (522)

  • No. In brackets represent

actual no. of children

(Lower is better)

slide-5
SLIDE 5

12/06/14 5 Children in Care Benefit from Stable Placements

NI 63 - Percentage of children who have been in care for 2.5+ years and have been in the same placement for 2+ years

(Higher % is better)

NI 62 - Percentage of children in care who have had 3 or more moves in the last year

(Lower % is better)

16.5% 10.5% 14.4% 11.6% 10.1% 11.3% 14.4% 13.4% 65.8% 60.9% 63.4% 70.9% 70.6% 65.6% 62.4% 65.1% 0.0% 10.0% 20.0% 30.0% 40.0% 50.0% 60.0% 70.0% 80.0% 2006/07 2007/08 2008/09 2009/10 2010/11 2011/12 2012/13 2013/14

Stability of placements for Children in Care

NI162 Gloucestershire NI162 Statistical Neighbours NI163 Gloucestershire NI163 Statistical Neighbours

(Data labels show Glos figures)

Adoption

24 18 14 24 27 14 25 50 10 20 30 40 50 60 2006-7 2007-8 2008-9 2009-10 2010-11 2011-12 2012-13 2013-14

  • No. of children adopted
  • No. of children leaving care with an adoption order in 13/14

Gloucestershire is one of

  • nly 38 local authorities

which met both DfE thresholds for speed of adoption. Continuing improvement in 2013/14

  • 50 children adopted
  • 36 additional children

currently matched and placed with adopters

  • 50 adopters approved

(with more underway)

slide-6
SLIDE 6

12/06/14 6

School Absence Rates

Overall absence rates have increased slightly in primary schools but the general direction of travel is a reduction. (Lower is better)

6.70% 6.30% 6.20% 5.90% 5.90% 4.90% 4.80% 4.80% 4.30% 4.40% 0% 1% 2% 3% 4% 5% 6% 7% 8% 2008/09 2009/10 2010/11 2011/12 2012/13 Overall % of days absent Academic Year

Overall absence rates in Gloucestershire and England

Gloucestershire Secondary England Secondary Gloucestershire Primary England Primary

Data labels show Glos figures

Families First

  • Our Families First programme remains on track.
  • To date, over 300 families have experienced positive
  • utcomes in terms of children attending school,

reductions in crime and anti-social behaviour and parents in work or on the path to work.

slide-7
SLIDE 7

12/06/14 7 Adult Social Care Support Pathway

Current Challenges

  • Increasing the number of

people starting high impact reablement

  • Reducing the number of
  • utstanding

assessments/reviews

  • Reducing admissions to

residential and nursing care

  • Targeting high level of long-

term absence among staff

  • Budget pressures

Request for Service Short Term Support

(e.g. Reablement & Enablement)

Long Term Support

Community e.g. Dom care) Residential/Nursing

End Reasons:

No services required / provided (declined/self-funding/needs change/move away) End of Life Signposting / Universal Services

Assessment Assessment

Assessment

Re- assessment

Support for Carers

Reablement

The percentage of people completing reablement in more than 6 weeks continues to decrease. Reablement continues to have challenges with staff contact time, staff sickness and ensuring people are staying at home following reablement.

  • No. In brackets represent the

actual no. of older people

(Lower is better)

25.9% 33.2% 29.2% 36.5% 30.6% 23.7% 23.1% 22.0% 0.0% 5.0% 10.0% 15.0% 20.0% 25.0% 30.0% 35.0% 40.0% Jun-12 Sep-12 Dec-12 Mar-13 Jun-13 Sep-13 Dec-13 Mar-14

% of reablement lasting over 6 weeks

(315) (339) (173) (284) (308) (227) (193) (172)

slide-8
SLIDE 8

12/06/14 8

Timeliness of Reviews

We continue to make progress in reducing the number of outstanding assessments and reassessments, ensuring priority is given to those service users who are at the highest levels of risk.

(Higher is better)

75.4% 66.6% 69.2% 79.3% 60.0% 65.0% 70.0% 75.0% 80.0% 85.0% 10/11 11/12 12/13 13/14

% of service users who have been reviewed or assessed in the previous year

Admissions to residential and nursing care

  • Through the Integrated

Discharge Team’s, ‘Getting the Fosters Home’ initiative and our External Care Recovery Plan, we aim to have fewer older people admitted to residential and nursing care over the coming year

660.55 654.11 685.21 791 856.72 896.75 836.25 822.7 500 550 600 650 700 750 800 850 900 950 Jun-12 Sep-12 Dec-12 Mar-13 Jun-13 Sep-13 Dec-13 Mar-14 Rate per 100,000 population

Rate of permanent admissions aged 65+ to residential nursing care homes

Actual Target (740) (768) (927) (733) (963) (1008) (940) (963)

  • No. In brackets represent the

actual no. of older people

(Lower is better)

slide-9
SLIDE 9

12/06/14 9

Learning Disabilities Employment

7.6% 6.7% 12.0% 12.6% 0.0% 2.0% 4.0% 6.0% 8.0% 10.0% 12.0% 14.0% 2010/11 2011/12 2012/13 2013/14

Adults with learning disabilities in employment

  • The number of adults

supported in employment by the council continues to grow.

(229) (190) (115) (140)

Smoking

  • We set a challenging target

this year for the overall number of people who successfully quit smoking at four weeks (1800 above the recommendation from National Institute for Health and Care Excellence, NICE).

  • Although we have fewer

quitters than planned, our current performance is within acceptable levels.

989 829 837 1,072 866 755 642 200 400 600 800 1000 1200 1400 Jun-12 Sep-12 Dec-12 Mar-13 Jun-13 Sep-13 Dec-13

  • No. of smokers quitting
  • No. of smokers achieving a 4 week quit

Total Quitting Deprived areas &/or routine/manual jobs Pregnant Women Mental Health Total Target

Data labels represent total quitters

slide-10
SLIDE 10

12/06/14 10

  • The planning application for approval of the £15m Elmbridge Park and

Ride scheme has now been submitted.

  • A new submission bid has also been made for £5m of the

Government’s second ‘Local Sustainable Transport Fund’, with awards expected in early summer.

  • The C&G/Walls Roundabout scheme continues on track.
  • The project to convert Gloucestershire street lights to low carbon Light

Emitting Diode (LED) has been approved.

Communities and Infrastructure

Fire and Rescue

  • The Fire & Rescue service has similar levels of incidents

compared to previous years.

  • The overall average achievement of the 8 minute

response time for dwelling fires is 66% against a target of 75%.

slide-11
SLIDE 11

12/06/14 11

  • Primary school children

being actively targeted through SkillZONE experience.

  • Older age group

targeted through award winning programme Safer Driving with AGE (SAGE).

Road Safety

36 53 38 40 39 19 27 20 33 32 240 219 230 216 220 217 160 225 222 180 2438 2321 2060 1744 1609 1488 1348 1333 1192 842

500 1000 1500 2000 2500 3000 Number of casualties

Casualties by severity

Fatal Serious Slight

  • The year-end revenue position is an under-spend position of

£127,000 (0.03% of the net budget).

  • Due to slippage, we have a minor under delivery on this year’s

savings for MtC projects. This shortfall had been offset by additional savings generated throughout the year to balance the budget.

  • Overall £35m of savings have been delivered in 2013/14.

Good Value for Money

slide-12
SLIDE 12

12/06/14 12

Staff Sickness

8.15 7.56 7.61 7.7 8.6 7.9 8.7 6.8 7 7.2 7.4 7.6 7.8 8 8.2 8.4 8.6 8.8 11/12 12/13 13/14

  • No. days per FTE
  • Av. Days sickness per full time equivalent

GCC UK UK Public Sector

  • We have under achieved
  • n our target for absence

levels this year with 7.61 days lost per Full Time Equivalent (FTE) employee against a target

  • f 7.4 days.
  • However sickness levels

in the council are much lower than other public sector organisations.

Staff Numbers for each year shown as FTE in brackets

(Lower is better)

(3,074 FTE) (3,596FTE) (3,847 FTE)

Waste

440 450 460 470 480 490 500 510 520 530 Tonnes

Residual household waste per household

Target 40 42 44 46 48 50 52 54 56 58 60 %

% of waste sent for reuse, recycling or composting

Actual Target

slide-13
SLIDE 13

12/06/14 13

  • Our ‘Fastershire’ broadband projects and The Funding Circle

Scheme are making good progress.

  • Over the year, the Youth Economic Stimulus Project has

improved outcomes for young people in Gloucestershire by:

  • Successfully recruiting over 20 apprentices to GCC,
  • Celebrating young people’s achievements through the Showcase Award Ceremony,
  • Supporting them with advice around career and skills (linked to GROW skills initiative),
  • Contributing to the reduction of 18-24 claimants (through the Opportunity YES scheme).

Economic Development Compliments & Complaints

  • what service users are telling us

2013/14 Children's Social Care Adults Social Care Gloucestershire Highways Number of complaints 175 208 57 Number of complaints upheld 50 44 28 % of complaints upheld 29% 21% 49% Number of compliments 153 237 468