
SLIDE 1
28/07/2016 1
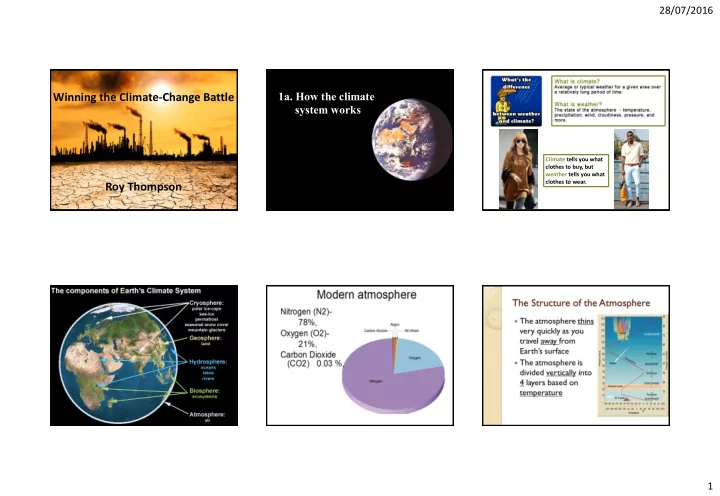
Winning the Climate-Change Battle Roy Thompson
- 1a. How the climate
system works
Climate tells you what clothes to buy, but weather tells you what clothes to wear.
Winning the Climate-Change Battle system works Climate tells you - - PowerPoint PPT Presentation
28/07/2016 1a. How the climate Winning the Climate-Change Battle system works Climate tells you what clothes to buy, but weather tells you what clothes to wear. Roy Thompson 1 28/07/2016 Earth's winds and The sun delivers more energy to
Climate tells you what clothes to buy, but weather tells you what clothes to wear.
On a worldwide, long-term average, air molecules absorb 16% of the incoming energy and reflect 6%. Clouds absorb 4% and reflect 20%. 54% is transmitted through the atmosphere and hits the Earth's surface.
The sun delivers more energy to the earth in just one hour than is currently used worldwide in one year.
Earth's winds and atmospheric circulation
The energy from the sun also powers our ocean currents and the water cycle, causing clouds and driving hydrological processes.
The life of photons - their death and rebirth
Solar radiation is absorbed by the sunlit side of Earth, and infrared radiation (heat) is emitted from all parts of the planet.
We need to think about two types of radiation:-
First the energy (light) from the sun Secondly the infrared energy Earth radiates back into space The red line shows the radiation from the Sun received at the top of Earth's atmosphere (assuming a solar temperature of 5770K). The black line shows the radiance emitted by Earth assuming a terrestrial temperature of 288K.
A body that suppresses heat loss cools off less, which is to say “stays warmer.” As the thermal camera testifies:- notice the bright thermal radiation escaping from the children’s bare faces versus the darkness of their winter jackets.
There are enormous transfers of energy into and from the Earth. It receives short wave electromagnetic radiation from the sun and emits long wave radiation to space.
Not all of the solar radiation reaches the Earth’s surface, due to reflection and scattering
The wavelengths of incoming solar radiation and emitted radiation absorbed by the Earth's atmosphere, showing the solar window and atmospheric (thermal) window. The graph shows the regions of the electromagnetic spectrum that are absorbed by specific
UV, ultraviolet light; vis, visible light.
There are 2 so-called atmospheric windows
Spectroscopy: The interaction between matter and electromagnetic radiation
MOLECULES: The combination
to the creation of numerous additional unique energetic states ATOMS: Atomic absorptions and emissions (spectral lines) are due to electronic transitions of outer shell electrons as they rise and fall from one electron orbit to another.
Precision infrared radiometer, Point Barrow CERES satellite
At launch on Oct. 5, 1984 one of the solar arrays on the Earth Radiation Budget Satellite (ERBS) failed to extend. So mission specialist, Astronaut Sally Ride aboard Space Shuttle Challenger, had to shake the satellite with the remote- controlled robotic arm and then finally place the stuck panel into sunlight for the panel to extend.
Recently NASA launched its first satellite dedicated to measuring atmospheric carbon dioxide. OCO-2 makes about a million measurements each day.
CO2 concentration February 08 406.27 ppm
Annual greenhouse gas emissions by sector
In 1957 Revelle and Suess discovered that the chemistry of sea water prevents the oceans from quickly absorbing any excess carbon dioxide.
January through June 2016 was the hottest ever recorded. It is now virtually certain that 2016 will be the hottest ever recorded.
Computer modelling
Palaeoclimate
Sea-level / glaciers / plants / isotopes / atmospheric composition / temperature
His 1967 paper gave the first modern prediction of how much increased carbon dioxide (due to fossil fuel use) would warm the earth. In 1967 you could pick up a 1.3 MHz CPU with half a megabyte of RAM and 100 megabyte hard drive for a mere US$1.6 million. Oh, and you want a printer too…?
Suki Manabe
“God-father"
2.4 °C rise for 2xCO2
$350 million UK's fastest supercomputer
Antarctic ice: the world's air museum
Climate Sensitivity Estimated From Earth's Climate History
ESS of 3 to 6 °C for 2xCO2
Temperature ~ Greenhouse gases + aerosols + ENSO + Volc
(Thompson, 2015)
CO2 Aerosols
An empirically based energy balance forecast
Volcanoes El Niño
Heat balance in terms of a time-series analysis
Multiple regression:
WMGHG AEROSOL VOLCANO ENSO
(Thompson, 2015)
4 oC for 2xCO2
BERKLEY
Using CMIP5 (the most ambitious coordinated multi- model climate change experiment ever attempted) to check sensitivity as found using the empirical approach.
KIEV MINNEAPOLIS IS WIND NDHO HOEK
SUMMARY OF EMPIRICAL APPROACH
significant forcings.
aerosols needs to be carefully disentangled.
sensitivity are high, +4 oC (with 95% confidence intervals of 3.0 to 6.3 oC)
2100.
year heatwaves, in most years, by 2100 on a BaU trajectory.
breached before 2030.
Note the amplified warming projections for the high latitudes and altitudes of the northern hemisphere.
Based on CMIP5 models.
Stippling indicates areas where at least 70% of the models agree on the sign of the change.
State-of-art modelling of precipitation change.
28 CMIP5 multi-model ensemble average mean change in frequency of dry days (days/year) by 2060–2089, relative to the historical period 1960–1989, using the RCP8.5 forcing scenario.
Global temperatures
last updated 2016/01/20
NASA’s current satellite fleet includes 20 Earth-observing missions
Since the 1957 launch
thrust mankind into the space age, the U.S. and other space-faring nations have placed thousands of artificial satellites into a variety of Earth- centered
Latest GRACE satellite results
GRACE reveals that most ice loss in Greenland has been from near the ice sheet margins, while the ice sheet interior has experienced a slight mass gain owing to increased snowfall.
MODIS The world is greening earlier, but becoming browner
MODIS
1980-2015
Thompson, Unpub.
Continent-wide response of mountain vegetation to climate change (2001-8)
”Clear shift towards species that prefer warmer temperature at 60 summit sites, (867 vegetation samples) in 17 mountain areas across Europe” Thompson, 2011
Recent developments in LED technology create new
lighting of greenhouse crops. High-pressure sodium lamps with
cast moving beams
below in order to increase yield, inhibit dormancy, or accelerate flowering
Managing Daylength in Commercial Greenhouse and Nursery Production
Douglas-fir sample from the Southwest USA has annual tree rings dating back to 1527. The narrowing of the rings that formed from the 1560s through the 1590s indicates that the tree grew little during the 16th century megadrought.
Scientists also look beneath the ocean surface
Ocean Acidification
Acidifying oceans spells trouble for squid The shells of Antarctic marine snails (Limacina helicina - the sea butterfly) are being dissolved by ocean acidification Cavolinia inflexa’s calcareous shell is very sensitive to pH Rising water temperatures block photosynthetic reactions leaving coral a bleached white.
Acidification even effects organisms without shells
Giant plastic bags deployed in unique study of ocean acidification
Smallest plankton grow fastest (with rising CO2) depriving larger phytoplankton of nitrates
The United Nations has warned that ocean acidification could cost the global economy US$1 trillion per year by the end of the century.
Sea-level rise from altimetry
G Milne Time evolution of climate variables for constant-CO2- emission commitment simulations under four RCP scenarios: (a) Diagnosed CO2 emissions (b) atmospheric CO2 (c) Surface air temperature (d) Ocean thermal expansion
Climate impacts will continue for 1000s of years even after elimination of all greenhouse emissions
James Croll - visionary 19th- century Scottish scientist (1821 – 1890)
Probable birthplace, Little Whitefield, Tuesday 2nd of January 1821
When James was three years old, the family croft was cleared by the landowner, Lord Willoughby, and displaced to an area of bog-land a mile to the west at Wolfhill.
pioneered the idea
feedback effects in climate studies.
the duration of the seasons, and hence on climate
Tyndall's 1872 setup for measuring the heat absorption of gases
The Swedish meteorologist Anders Ångström (1888 – 1981) not to be confused with his more famous grandfather. Knut Ångström (1857–1910), eminent Professor of Physics, studied the absorption of solar radiation by water-vapour, carbon dioxide and ozone. Anders Jonas Ångström (1814 – 1874) Swedish physicist, studied the light coming from the sun. His pioneering contributions to science were sufficient to have a tiny unit of length named after him, the angstrom, which is one ten-billionth of a metre.
The remarkable Ångström dynasty from Uppsala
Penck and Brückner
The Deep Sea Drilling Project (DSDP) operated from 1968 to 1983, and continues today as IODP.
positive climate feedbacks (1864) ushered in the modern age of climate change.
understood by Tyndall, Arrhenius and Ekholm (1897).
buffering & Manabe’s pioneering modelling of how the Earth’s atmosphere behaves (1963) reignited an awareness of the dangers of fossil-fuel burning.
records confirm and extend the 2-4.5oC climate sensitivity of computer models.
Land temperatures have increased by 1.5 oC over the past 250 yr. Sea-level has risen 10-20 cm in 100 yr, and is accelerating rapidly. Spring is starting earlier, but plant and animal behaviour is desynchronising and the Earth is becoming browner.
Five types of climate change denial argument
1 Conspiracy theories (Vast conspiracy by
scientists to deceive in order to win funding and/or status.)
2 There is no consensus (But only between fake-
experts and non-specialists.)
3 Impossible expectations (e.g., requiring 100%
proof; climate models are uncertain; IPCC reports are flawed, incomplete or fuzzy science.)
4 Misrepresentations & logical fallacies (e.g.,
scientists can’t even predict the weather; climate has changed in the past.)
5 Cherry-picking (Ignoring all other evidence,
e.g., global warming stopped in 1998.)
Main sceptical arguments of climate-economics
1 Rate of technological advance (e.g., RCP8.5 is
too conservative and not representative of business-as-usual.)
2 Damage costs (e.g., CO2 &T make plants grow
better; uncertainties over impacts on society.)
3 Mitigation costs (e.g., renewables are already
too expensive; we can never know the full costs with a reasonable level of precision.)
4 Other priorities (There are more pressing
concerns, e.g., child mortality, AIDS, malaria, TB, malnutrition, clean water, E-Government.)
5 Low risk of tipping points (Nature is robust,
mankind is resilient; Malthus was wrong.)
Main Skeptic Arguments
1 Climate's changed before 2 It's the sun 3 It's not bad (+ive impacts far outweigh any –ives) 4 There is no consensus 5 It's cooling (warming has now stopped) 6 Models are unreliable 7 Temp record is unreliable 8 Animals and plants can adapt 9 It hasn't warmed since 1998 10 Antarctica is gaining ice 11 CO2 lags temperature 12 Ice age predicted in the 70s 13 Climate sensitivity is low 14 We're heading into an ice age 15 Ocean acidification isn't serious 16 Hockey stick is broken 17 Climategate CRU emails suggest conspiracy 18 Hurricanes aren't linked to global warming 19 Al Gore got it wrong 20 Glaciers are growing 21 It's cosmic rays 22 1934 - hottest year on record 23 It's cold today! 24 Sea level rise is exaggerated 25 It's Urban Heat Island effect 26 Medieval Warm Period was warmer 27 Mars is warming 28 Arctic ice-melt is a natural cycle 29 Increasing CO2 has little to no effect 30 Oceans are cooling 31 Human CO2 is a tiny % of CO2 emissions
John Cook, founder of the blog Skeptical Science Wins Award for communication that motivates action to reduce the impacts of climate change.
The Paris Climate Agreement – grounds for optimism,
and grim foreboding?
“…pursue efforts to limit the temperature increase to 1.5 °C above pre-industrial levels…”
Article 2.1(a)
Web-based reports of reactions to the Paris Agreement
Marshall argues that our evolutionary
and how we respond to threats. Climate change challenges and reverses some deeply held assumptions. The way of life we previously associated with comfort, wellbeing and material progress is now seen as dangerous. We are best prepared and inordinately skilled at identifying and anticipating threats from other humans, but not from ourselves. We are wired to be alert to dangers that are concrete, immediate and certain. But climate change is gradual, hard to
requires making palpable sacrifices now in order to prevent unclear costs in the distant future. Climate-change deniers are not normally short on scientific literacy. Deniers are generally better versed in the science than accepters. Climate change being a very complex science with profound uncertainties is exceptionally
In the end, Marshall is neither fatalistic nor idealistic about our chances of
climate change, but we’re also wired to do something about it. Human history provides many examples of social movements that have overcome apparently impossible obstacles.
The United Nations Climate Change Conference, COP21 was held in a Paris from Nov 30 to Dec 11, 2015
national problem
probability catastrophic
2. Irreversibilities 3. Long time-scale 6. Externalities 5. Large uncertainties
Three simple numbers that add up to a global catastrophe…
The First Number: 2°C
A 2°C target is often used in International negotiations as a guide line for avoiding dangerous climate change.
The Second Number: 900 Gigatons
Humans can pour roughly 900 Gt of carbon dioxide into the atmosphere and still have some hope of staying below two degrees.
The Third Number: >11,000 Gigatons
This number – the scariest of all – describes the amount of carbon contained in coal, oil, gas & hydrofracking
10 times higher than the 900 Gt ‘limit’.
Adam Smith’s insight
“The market is the most creative and dynamic economic engine known to man.”
Lord Stern The problem: Smith’s invisible hand sets prices incorrectly when a by-product of economic activity (eg CO2) damages innocent bystanders. Canongate Kirkyard
Discounting - a major econometrics headache How should we value a sustainable future? A bird in the hand …
1968 Tragedy of the commons
(Hardin)
1972
Limits to growth (Meadows et al)
1979
Gaia theory (Lovelock)
1989
Blueprint for a green economy (Pearce)
Today Market based, utilitarian approaches
(with a focus on energy efficiency & international political agreements)
Garrett Hardin addressed the conflict between the short-term interests of individuals and the long-term welfare of society.
“The climate and the chemical properties of the Earth throughout its history seem always to have been optimal for
by chance is … unlikely”
David Pearce
economic decisions, the environment needs to be assigned economic values.
Even though it is not possible to put an exact value on the environment, it is necessary try to show that environmental services are not free.
More attention should be given to planning for the inheritance of future
that is no less than we have today.
absence of a price, there is no mechanism to restrict consumption and to curb environmental damage. Hence there is a need to internalize environmental and climatic externalities.
Social unrest 2015 Heat deaths Karachi 2015 Malaria Dengue fever West Nile virus
Damage function
(US$78 trillion)
What Would it Really Cost to Reduce Carbon Emissions?
Power plant near Page, Arizona
Costs of global emissions reduction
Rise in global energy production
Yoichi Kaya Japanese energy economist
Kaya identity and global CO2 emissions
Data shown 1970-2005
China Global
Despite Kyoto, global CO2 emissions are rising even faster than business-as- usual projections.
Where are we now?
Optimisation of the economic/energy-balance analysis
Disentangling the Nordhaus/Stern controversy
Lord Stern:
Claims the benefits of strong, early action outweigh the costs. Prefers cap and trade. Champions a low discount rate
Nordhaus:
Strongly favours a carbon tax (initially around $10/ton), and has criticised the Stern Review for its use of a low discount rate.
Carbon Tax,
& Trade?
UK coal production (1820-2010)
Renewables? Nuclear? Peak Oil? Peak Coal?
Billionaire Texas oilman, developer and philanthropist
Fracking operations near a farm over the Marcellus shale formation in Pennsylvania
Horizontal drilling:
a key process – laterals can extend
Hydrofracturing:
1 to 5 million gallons of water, mixed with sand and chemicals, are required for fracking each well.
. 1860-2014, in millions
Hydraulic fracturing in Bradford Co. PA. Water from Carol French’s well Fracking led to $4.1M settlement
Fracking pit for contaminated (carcinogenic) wastewater
Is the Shale Boom Causing Ozone Pollution?
17,685 wells in south–central Texas
Schade and Roest 21 April 2015 Gas flaring & crescent-shaped scatter of night light
Test drilling to go ahead in Falkirk area despite fracking ban
Most UKCS fields are very small, similar to Signal Hill, Long Beach, California in 1937.
How Does Marine Seismics Work? 1975: The first commercial 3D survey recorded in the North Sea
Subsea drill bit
Since 1965 3,970 exploration and appraisal wells have been drilled on the UKCS, at a cost of £58 billion.
Since 1966, over 45,000 km of pipelines, umbilical and cable has been Installed in the North Sea
2.Rigs to Reefs program
heavy decommissioning lift of the Welland gas production platform in the southern North Sea.
27,000 abandoned
wells lurk beneath the Gulf of Mexico
First minister accused of selecting optimistic economic forecasts to bolster his case for independence.
Alex Salmond said there can be 'little doubt that Scotland is moving into a second oil boom'.
Geological context: deep-marine source rocks & sand reservoirs.
Kezia Dugdale, Murdo Fraser, Willie Rennie and Patrick Harvie reacted to the GERS overspend report
Dugdale:
“People were misled by the SNP … and that is unforgivable.“
Fraser:
The [figures] shed new light on the SNP's deception.”
Rennie:
“Ms Sturgeon’s … credibility had been smashed to smithereens.”
Harvie:
“Urgent need of a bold transition plan … that will make huge gains in industries like decommissioning, food production and renewables.”
The End of the Oil Age?
The largest point of disagreement is how much
reserve in the Persian Gulf.
A satellite image of a
large anticline, Kuh-e Namak, in south-west
contain enormous oil and gas accumulations
Dubai’s massive solar project at Mohammed bin Rashid Al Maktoum, 5,000 megawatts by 2030
Scotland's energy "quadrilemma" – the need to simultaneously
Hunterston B 1,288 MW Torness 1,364 MW Peterhead 1,550 MW
Scottish electricity output: Nuclear vs. Gas vs. Renewables
Total renewables 7,444 MW
2016: SNP pledges even tougher emissions targets!
“The re-elected SNP Government will raise Scotland’s 2030 climate target to a new higher target.”
Dan Barlow
carbon capture.
Europe’s largest onshore wind farm, East Renfrewshire (522MW) World's largest floating wind farm
(30MW pilot) Scotland’s largest solar farm: Carse of Gowrie (14MW) UK’s largest wood fired biomass station, Lockerbie (44MW)
Scotland could cost-effectively become Europe’s carbon capture and storage hub, building on existing pipelines and offshore infrastructure and saving on oil decommissioning costs. Net transfers of embodied emissions (in megatonnes of CO2) resulting from bilateral trade.
UK coal production (1820-2010)
Professor David Rutledge, Caltec
Shanxi, the coal producing capital of China Historical Projections Compared with Reserves
164
On a positive note most of the fossil carbon remains in the ground, so humankind can still take strong actions to limit global warming.
The carbon reserves map demonstrates the inequitable distribution of proven fossil fuels, and helps visualisation of likely diplomatic problems associated with fossil carbon divestment.
Space mirrors Sulphate aerosols
Marine cloud brightening (Salter)
Enhanced weathering
Plan-A Mitigation Plan–B
Adaptation
Plan-C
Geoengineering
What can we do about Climate Change?
Mitigation: Seeks to reduce the sources, or enhance the sinks of greenhouse gases in order to stabilize CO2 levels
Nuclear Solar Tidal
Boundary Dam Coal-fired Power Station and Post- combustion CCS. Forest clearing in Johar. Biochar - a carbon-rich product, created by the slow burning of plant material with no oxygen. Steven’s Croft in Lockerbie - the UK’s largest wood fired biomass station, supplies the electrical needs of 70,000 Scottish homes.
Carbon capture Biochar Biofuels Reforestation
Seeks to reduce the vulnerability of social and biological systems and thus to offset the effects of global warming
Sea level: Keep on building higher and higher
barriers as the oceans rise
Venice, 2008
Infrastructure:
keep on repairing the damage caused by more and more extreme weather events
Alyth July 2015 Glasgow, January 2012
Food security: Try to keep on improving water
supplies, and keep developing more and more new cultivars and new crop varieties as the climate changes
Space mirrors Sulphate aerosols
Marine stratocumulus clouds (Salter)
Enhanced reflectivity
Plan-C: Geoengineering
Edward Teller et al. (1997)
Small-angle-scattering system, using modest quantities of either conductors or dielectrics ($50–500 billion), in deep space.
Climate impacts
aerosol geoengineering
There is a growing realisation that it is unlikely that stratospheric sulphate will be distributed evenly between the two hemispheres owing to the Brewer Dobson circulation.
The change in annual mean precipitation (mm month-1) and the percentage change in the Net Primary Productivity for scenarios where SO2 is injected into either the northern hemisphere or the southern hemisphere.
Dispose of CO2 through mineralization
ENHANCED CHEMICAL WEATHERING AS A GEOENGINEERING STRATEGY TO REDUCE ATMOSPHERIC CARBON DIOXIDE Jens Hartmann et al. May, 2013
CO2 Mineralisation Project to turn released carbon into commercial products.
Industrial flue gas is fed into a high temperature and high pressure environment to create a reaction between the CO2 and chemical solutions and produce useful mineral-based products.
Mitigation of CO2 emissions by fast weathering of olivine in high-energy seas
400,000 tonne mega-carrier Lab and flume experiment
Climate change is a super wicked problem
difficult to clearly define, have many interdependencies, are often multi-causal, socially complex, not stable - as the understanding of the problem is constantly evolving.
as they exist in complex systems that exhibit unpredictable, emergent behaviour.
contradictory, and changing requirements there is often no right or wrong response, many are characterised by chronic policy failures, the solution hardly ever sits within the remit of any single organisation.
The Science and Politics
Seven "stabilization wedges" as envisioned by Socolow & Pacala. Although much of the needed technology and know-how exists, the real key lies in how to rapidly deploy it in our power plants, buildings, factories and vehicles, and improving land management practices, given the profound inertia in our social, political and economic infrastructure.
Air pollution kills 5.5 million people a year worldwide, mostly from strokes and heart attacks.
Edinburgh St Leonards. Site ID: ED3. (The nearest main road, Pleasance is approximately 35m away.) Air pollution concentrations are so high they are regularly breaking national safety
pollution is caused by road traffic. Traffic-Related Pollutants in Urban Centres: A Case Study of the Seagate, Dundee.
Olivine from the Eifel, Germany and some ground dunite powder.
Injecting aerosols into the stratosphere mimics the cooling effects of volcanoes
“Awarded for work in atmospheric chemistry, particularly concerning the formation and decomposition of ozone.”
Urban sprawl - Aerial view of the north west (1/8th) of Livingston
A Vision for Edinburgh and South East Scotland
Over the next 20 years the predicted growth in the number of households in the area is 25%. The city of Edinburgh, East and West Lothian, Midlothian, the Borders and Fife will be the region's main population growth areas. In short, in just the next 10 years more than 100,000 new homes will be needed.
Smart Cities Could Save $17 Trillion, By 2050, Just By Reducing Their Greenhouse Gas Emissions
Cities are a big source
However, annual emissions per household are half of those in the less efficient, car- dependent suburbs. Average Household Carbon Footprint
Inner city residents have lower carbon footprints as they live in smaller homes and use more public transport. Suburbs are ideal candidates for energy efficiency technologies:- whole home energy upgrades, solar photovoltaic systems and electric vehicles.
Mass transit is a key ingredient in a sustainable, low-carbon transport future
Climate and development with a focus on the global south.
Debt relief to developing nations, with the caveat that funds previously allocated to finance debt go instead toward investing in infrastructure and to other climate change adaption & mitigation efforts.
energy efficiency dominant
Arthur Pigou
A Pigovian tax is a levy
(damage) as an incentive to avert the costs (to society). In a true market economy a Pigovian tax is the most efficient and effective way to correct a negative externality.
1920
The unsung inventor of the revenue-neutral energy tax Carbon Fee & Dividend
(A smart carbon tax)
(None goes to the politicians)
stimulated by Adam Smith’s invisible hand
Having flogged for 21 years, the dead horse of legally binding emission targets, the UN should close that chapter and try something new.