Where do Weather Forecasts and Climate Predictions Come From? - - PowerPoint PPT Presentation

where do weather forecasts and climate predictions come
SMART_READER_LITE
LIVE PREVIEW

Where do Weather Forecasts and Climate Predictions Come From? - - PowerPoint PPT Presentation

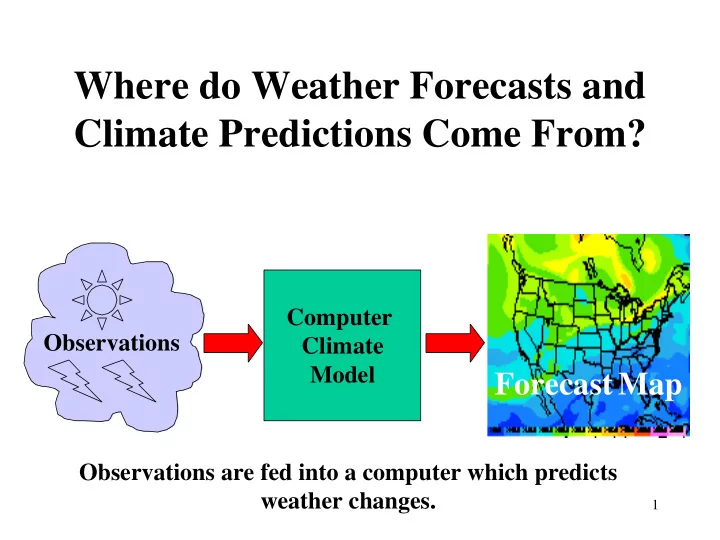
Where do Weather Forecasts and Climate Predictions Come From? Computer Observations Climate Model Forecast Map Observations are fed into a computer which predicts weather changes. 1 Computer models are made up of many smaller models


slide-1
SLIDE 1

1

Where do Weather Forecasts and Climate Predictions Come From?

Computer Climate Model Observations

Forecast Map

Observations are fed into a computer which predicts weather changes.

slide-2
SLIDE 2

2

Computer models are made up of many smaller models

Large Climate Model

Sub Model Sub Model Sub Model

Each sub-model focuses on some aspect of the atmosphere. One sub-model is the solar flux model. Observations Prediction

slide-3
SLIDE 3

3

The Solar Flux Model

Public1.f Solar Flux Model The Public1.f Solar Flux Model is a Fortran program that takes cloud property observations and produces an expected light frequency spectrum. Expected Spectrum Cloud Observations

slide-4
SLIDE 4

4

Inverting the Model

Observed Spectrum Satellite

  • Satellite gives an observed light spectrum

How do we get cloud properties from the spectrum

BUT

Cloud Observations

slide-5
SLIDE 5

5

Inverting the Solar Flux Model

Given an observed frequency spectrum, how do we predict cloud properties?

  • Compute a new model using the inverses of the functions

in the original model BUT, the original functions may not be invertible, OR the time needed to run the new model may be prohibitive

  • View the model as linear transformation and compute the

inverse transformation

  • View the model as a function and learn an inverse using a

neural network

slide-6
SLIDE 6

6

The Model as a Linear Transformation

We can view the model as a transformation of the form

I T = O

We want the inverse of this transformation:

O T’ = I

Cloud Observations Transformation Expected Frequencies Inverse Transformation

slide-7
SLIDE 7

7

O T’ = I, so T’ = I O’

Matrix I given cloud observations

If the model is linear, we expect I = O T’ BUT when we compute T’, I O T’

O T’ computed from T’ = I O’

slide-8
SLIDE 8

8

Inverting the Model with a Neural Network

Why use a neural network?

  • The function represented by the solar flux model

is non-linear.

  • Neural networks are capable of approximating

non-linear functions

slide-9
SLIDE 9

9

What is a Neural Network?

  • Neural networks are inspired by biological systems,

particularly the human brain.

  • Many small simple units, neurons, are connected

together in complex webs which are capable of performing many difficult tasks.

  • Neural networks are computer representations of neuron

webs.

  • Provide a general mechanism for machines to learn

functions, or classifications, from a set of examples.

slide-10
SLIDE 10

10

Basic Network Architecture

Network Inputs Network Output Hidden Layer Output Layer Neural networks are composed of layers of simple units. The number of units in each layer can vary, but the number of inputs to and outputs from the network are determined by the problem.

Different architectures can represent different functions.

slide-11
SLIDE 11

11

Basic Learning Mechanism

Neural Networks learn by example: Inputs and a desired output are given to the network. The network tries to produce the desired output from the inputs.

  • Each unit produces an output based upon a weighted sum of its

inputs.

  • The difference between the final network output and the desired
  • utput is calculated.
  • Weights in each unit are updated based upon a gradient decent in

the squared error.

  • The process is repeated as long as desired for each example.
slide-12
SLIDE 12

12

Steps for Inverting the Model with a Neural Network

  • 1. Design and implement neural network software

in JAVA

  • 2. Generate the data examples used to train the network
  • 3. Train different network architectures to see which

most closely match the examples.

slide-13
SLIDE 13

13

Design of Neural Network Software

Goals:

  • Vary the number of inputs and outputs the network

can handle

  • Vary the number of units in each of the layers
  • Vary the function the units use to determine output
  • Vary the rate at which the units change their

weights

Limitations of my implementation:

  • Network is constrained to two layers
slide-14
SLIDE 14

14

Creating Training Data

  • 1. Cloud observations are randomly created according

to a set of rules.

  • 2. Observations are fed into the solar flux model to create

frequency predictions.

Model Observations Frequencies

  • 3. Observations are paired with frequencies to create a

training example

We initially created 1000 training examples

slide-15
SLIDE 15

15

A Training Example

Frequency Data and Cloud Observations make Training Examples

A single training example contains input to and expected output from the neural network

slide-16
SLIDE 16

16

Constraining the Data

WHY:

  • Networks trained on random data did not learn

HOW:

  • Data was created so that each set of cloud observations

contained measurements for one cloud layer

  • 100 samples were created for each of 29 cloud layers
  • Each sample was run through the model and paired

with frequencies to create 2900 training examples

  • The examples were randomly reordered to prevent the

network from learning based on sample position

slide-17
SLIDE 17

17

Reducing the Data

WHY:

  • The constrained data contained 1003 inputs to the

network.

HOW:

  • The inputs were reduced from 1003 to 50 using an

eigenvector projection

slide-18
SLIDE 18

18

  • View the inputs to the network as a matrix.
  • We picked the eigenvectors associated with the 50 largest

eigenvalues of the covariance matrix of the input. These vectors contribute the most to the function that describes the input matrix. The new network input matrix is: I E = N

Original Input Eigenvectors New Input

slide-19
SLIDE 19

19

Training Different Networks

Hypothesis:

A neural network can successfully invert the public1.f solar flux model.

Desired network output, the cloud layer occurs at the spike

Success is measured by the number of correctly identified cloud layers in a group of unseen examples

slide-20
SLIDE 20

20

Trained a number of different networks

  • Used the constrained, reduced data
  • Varied the number of units in the hidden layer

between 10 and 100

  • Varied the rates at which the weights are updated

between 0.01 and 0.0001

  • Used both hyperbolic tangent and logistic

functions to determine a unit’s output Neural Net Observations Frequencies

slide-21
SLIDE 21

21

The Best Network

Architecture:

  • 80 units in the hidden layer
  • Hidden units used a learning rate of 0.01
  • Output units used a learning rate of 0.001
  • Unit’s output determined by a hyperbolic tangent

Results:

  • Each unit had a root mean error of 0.067
  • The network correctly identified 167 out of 290

unseen examples

slide-22
SLIDE 22

22

Sample Output

Correct Classifications: Incorrect Classification:

slide-23
SLIDE 23

23

Result Summary

Number of correctly identified examples by cloud layer

There are 10 examples for each of the 29 different cloud layers

slide-24
SLIDE 24

24

Correct by Maximum Value

Cloud layers are identified by 10 different values ranging from 0.07 to 0.9. The unseen examples are evenly distributed among these values.

slide-25
SLIDE 25

25

Error in Correctly Identified Examples

The difference between the desired network output and the actual network output ranged from 0.0002 to 0.7.

slide-26
SLIDE 26

26

Conclusions

  • Neural Networks are able to successfully invert the

solar flux model on a limited range of data

  • Once a network has been trained a sample can be

inverted VERY quickly.

The Next Step:

  • Work on identifying cloud layers with low maximum

values.

  • Train networks using less constrained data.