
SLIDE 1
An introduction to WS 2018/2019
- Dr. Sonja Grath
- Dr. Eliza Argyridou
Special thanks to:
- Prof. Dr. Martin Hutzenthaler and Dr. Benedikt Holtmann for significant contributions to
course development, lecture notes and exercises
Getting Started with R
2
What you should know after day 2
Part I: Getting started
- What is R
- How R is organized
- Installation of R and Rstudio
- Organize your R session
Part II: Basics
- R as calculator
- What is a function?
- What is an assignment?
- How to plot a continuous function and how to make a scatterplot
- Getting help
3
Part I Getting started
4
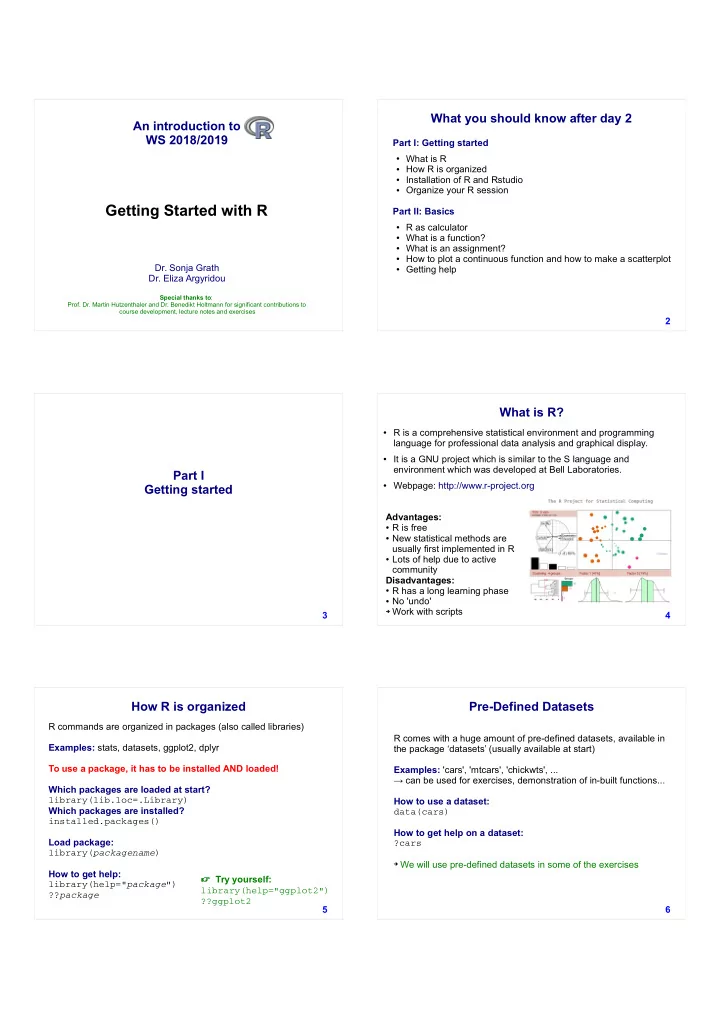
What is R?
- R is a comprehensive statistical environment and programming
language for professional data analysis and graphical display.
- It is a GNU project which is similar to the S language and
environment which was developed at Bell Laboratories.
- Webpage: http://www.r-project.org
Advantages:
- R is free
- New statistical methods are
usually first implemented in R
- Lots of help due to active
community Disadvantages:
- R has a long learning phase
- No 'undo'
➔ Work with scripts
5 R commands are organized in packages (also called libraries) Examples: stats, datasets, ggplot2, dplyr To use a package, it has to be installed AND loaded! Which packages are loaded at start? library(lib.loc=.Library) Which packages are installed? installed.packages() Load package: library(packagename) How to get help: library(help="package") ??package
How R is organized
Try yourself: library(help="ggplot2") ??ggplot2 6
Pre-Defined Datasets
R comes with a huge amount of pre-defined datasets, available in the package ‘datasets’ (usually available at start) Examples: 'cars', 'mtcars', 'chickwts', ... → can be used for exercises, demonstration of in-built functions... How to use a dataset: data(cars) How to get help on a dataset: ?cars
➔ We will use pre-defined datasets in some of the exercises