
SLIDE 1
What is Right for Downtown Boise? Tuesday July 15, 2014 Boise, - - PowerPoint PPT Presentation
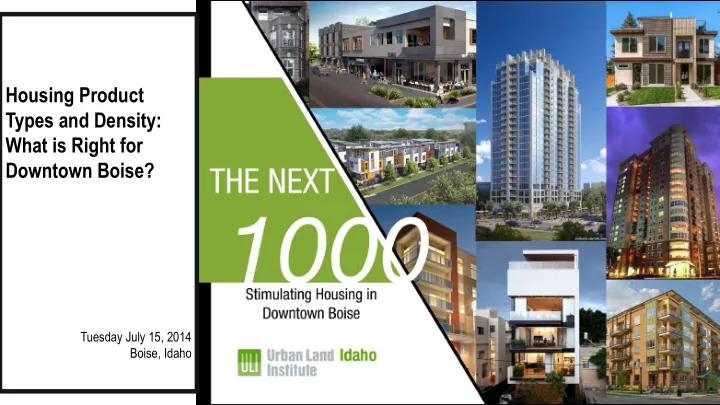
Housing Product Types and Density: What is Right for Downtown Boise? Tuesday July 15, 2014 Boise, Idaho The Current Demographics that Define Downtown Boise Census Tract 1 *Population: 4,210 *Households: 2,541 *Employment:32,752 **Median
5,000 10,000 15,000 20,000 25,000
50 100 150 200 250 300 350
20,000 40,000 60,000 80,000 100,000 120,000
50 100 150 200 250
10 20 30 40 50 60
500 1,000 1,500 2,000 2,500
200 400 600 800 1,000 1,200
50 100 150 200 250 300 350 400 450 500
0.0% 5.0% 10.0% 15.0% 20.0% 25.0% 30.0% 35.0%
0% 10% 20% 30% 40% 50% 60% 70%
39% 7% 8% 34% 5% 7% 63% 6% 7% 19% 2% 3% 44% 15% 18% 19% 0% 4%