What happens behind injuries? Key players missing important matches - - PDF document

what happens behind injuries
SMART_READER_LITE
LIVE PREVIEW

What happens behind injuries? Key players missing important matches - - PDF document

5/12/2012 ADVANCED ATHLETE MONITORING FOR INJURY REDUCTION Jose Fernandez BSc (Hons), PostGraDip (S+C) , CSCS BSMPG Conference 19/20 May 2012 Boston What happens behind injuries? Key players missing important matches (bad) Injuries leave


slide-1
SLIDE 1

5/12/2012 1 ADVANCED ATHLETE MONITORING

FOR INJURY REDUCTION

Jose Fernandez

BSc (Hons), PostGraDip (S+C) , CSCS

BSMPG Conference 19/20 May 2012 Boston

What happens behind injuries?

Key players missing important matches (bad) Injuries leave consequences (bad) Previous injury is the most important risk of injury factor (bad) Pressure for the team (bad)
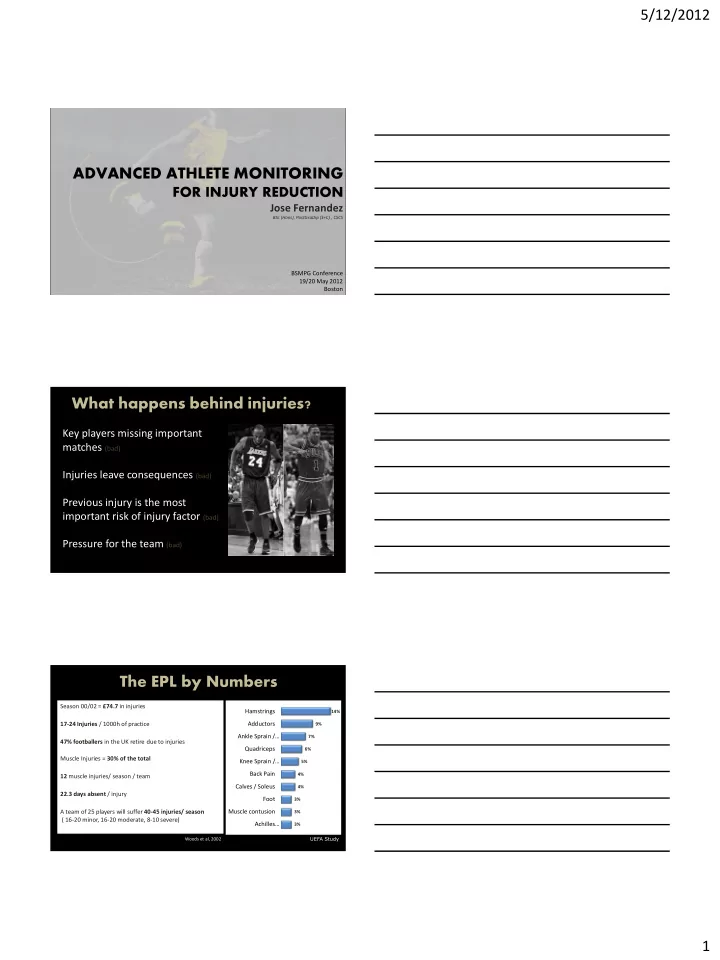
The EPL by Numbers

Season 00/02 = £74.7 in injuries 17-24 Injuries / 1000h of practice 47% footballers in the UK retire due to injuries Muscle Injuries = 30% of the total 12 muscle injuries/ season / team 22.3 days absent / injury A team of 25 players will suffer 40-45 injuries/ season ( 16-20 minor, 16-20 moderate, 8-10 severe)

Woods et al, 2002 3% 3% 3% 4% 4% 5% 6% 7% 9% 14%

Achilles… Muscle contusion Foot Calves / Soleus Back Pain Knee Sprain /… Quadriceps Ankle Sprain /… Adductors Hamstrings

UEFA Study

slide-2
SLIDE 2

5/12/2012 2 The challenge in professional teams

4.1 injuries / 1000h 2 games / week 25.6 injuries / 1000h! 1 game/week No effects on performance NBA Season Schedule 2011 / 12

Athlete Monitoring

A Practical Need

slide-3
SLIDE 3

5/12/2012 3 “We live in a dynamic environment”

Are we getting better? Is it worth the change? Information stays… Benchmark ourselves

Information = Intelligence

Measure Model “Predict”

Accumulate Intelligence Suggest the right move

We need models…

“We can´t anticipate the future but we must know what can perturb our plan”

slide-4
SLIDE 4

5/12/2012 4 Fatigue affects the efficiency of the neuromuscular system increasing the likelihood of injury.

For example…

Contraction Times Stiffness Functional Synchronisation Fatigue correlates with slower contraction times. Injuries are more likely to happen towards the end

  • f the game (acute) or final part of the season (chronic)

Fatigue affects neuromuscular delay Speed of contraction Decreased propioception Compromised RFD actions (P+S) Accumulated delay Biarticular muscles are especially affected Type II athletes are under more risk Decreased Joint Stability Increased likelihood of injuries

Alterations in muscle compliance are directly related to injuries…

slide-5
SLIDE 5

5/12/2012 5

Increased energy expenditure Altered Timing Decreased power and speed Decreased mechanical efficiency Minimized performance

Speed is the sum of muscle (intra muscle coord) and neural components (inter muscle coord and functional

synchronisation)

Integration Biochemistry Biomechanical Mental

Tensiomyography

(TMG)

Non invas asive Selec ective No inte terf rferen ence ce with training No effort t from m the athlet ete Highly rep epea eata table Low varia riability ty Quick asses essmen ent Imme mediate te results ts

slide-6
SLIDE 6

5/12/2012 6

7 6 5 4 3 2 1 0 100 200 300 400 500 600

<Tight Stiffness Loose>

<Fast Contraction Time Loose>

mm ms

Td – Delay Time

(neuromuscular delay)

10%

Tc – Contraction Time

(speed of contraction)

90%

  • 90%

Tr – Relaxation Time

(time remain contracted)

Dm – Displacement

(stiffness)

Athlete Readiness

Slow Contraction Times Great Stiffness Fatigue Fast Contraction Times Great Stiffness Increased Activation Slow Contraction Times Poor Stiffness Muscle Weakness

Ricky Rubio during a TMG Screening. FEB

…how is your best player feeling today?

Stiffness

  • C. Time

Left Right Left Right Left Right Left Right Left Right Left Right Left Right Left Right Left Right Left Right

VL VM RF RA GT BF ST GM GL AL

2 4 6 8 10 10 20 30 40 50

Slow Times Great Stiffness Fatigue Fast Times Great Stiffness Increased Activation Slow Times Poor Stiffness Muscle Weakness

slide-7
SLIDE 7

5/12/2012 7

Longitudinal data Integration with training? Integration with training?

PERIODIZATION

INTENDED ACHIEVED

6 3.5 4 0.5 1.5 5 4 3 1.5 5 1.5 3 5 3 3 3.5 1.5 5 4 4 0.5 3 1.5 5 1.5 5 3 2 1.5 5 3.5 3 3 1.5 5 5.5 3.5 1.5 5 1.5 2 5 5.5 3.5 2.5 1 5 5.5 5.5 4 2 1.5 5 1.5 5.5 3 2.5 1.5

LOAD

(RPE) Arbitrary Units INTENDED ACHIEVED MUSCLE SORENESS WILLINGNESS

slide-8
SLIDE 8

5/12/2012 8

Data Visualization?

HRV SLEEP RPE TMG BLOOD

DAILY WEEKLY SEMESTER ithlete Zeo TL S TC DM

Synch

Hm Fe G+ Ca vD B12 Mg FA Zn CRP Wb T E+ Ch CK

Player 1 Player 2 Player 3 Player 4 Player 5 Player 6 Player 7 Player 8 Player 9 Player 10 Player 11 Player 12

Case studies…

Fiber Composition, Muscle Imbalance, Rehab

Athlete Profiling

slide-9
SLIDE 9

5/12/2012 9

< 25% % Type I Muscle Fiber 75%>

34.8 31.5 41.5 30.9 43.4 35.3 37.3 59.8 62 54 47.7 33.2 35.4 62.6 28.8 39.2 44.5 38 Adductor L.

  • Lat. Gastroc
  • M. Gastroc

Semitendin Biceps Fem Gluteus M. Rectus Abd Rectus Fem Vastus Med Vastus Lat Average

Team Average EPL Average

36.5 38.7 72.3 Fast Profile Slow Profile 39.3

Slow Slow Slow Slow Slow Slow Slow Slow Slow Slow Fast Fast Fast Fast Fast Fast Fast Fast Fast Fast

Athlete “1” Athlete “2” Athlete “3” Athlete “5” Athlete “6” Athlete “7” Athlete “8” Athlete “9” Athlete “10” 31% 38% 32% 46% 32% 34% 41% 28% 40% 33% TMG Screening Pro Basketball Team

Pre Season 2011/12

Estimation of Type I Muscle Fiber

  • 3 Assessments during pre season
  • % Type I Muscle Fiber = Average from the 3 assessments
  • The following muscle groups were analysed on both sides:

GL,GM,VL,VM,RF,BF,ST,GM,AL,ES,RA,OE Athlete “4”

slide-10
SLIDE 10

5/12/2012 10

Muscular Potentiation

TMG Screening Pro Basketball Player Rectus Fem. Right side Potentiation W. up 1st Set 2nd Set 3rd Set 4th Set

Stiffness

  • C. Time

Befo re 34.6 29.2 26.3 26.6 26.6 34.8 5.5 8.3 7.5 7.2 7.4 4.5

  • 16%

+50%

  • 10%

+1.1%

  • 4%

+2,7% +44.3%

  • 40%

5th Set 34.9 4.3

What about Foam Rolling?

Protocol 1

Detect the area of max pain Hold for 30” + roll 5/6 times

Protocol 2

  • Cont. roll over the muscle

surface during 60”

Td Tc Tr Dm Td Tc Tr Dm

22.5 20.5 22.7 21.4 13.6 10.7 6.1 5.1 21.5 22.7 22 22.7 11.8 12.5 6.2 6.2 2.7% 3.1% 5.9% 9.9% 5.8% 22.2% 14.8%

30” HOLD ON TRIGGER POINT 60” CONT. ROLLING

Activation Relaxation

slide-11
SLIDE 11

5/12/2012 11 Rehab Monitoring

Stiffness Contraction Time TMG Screening

Pro Football Player Biceps Femoris Strain Rehab screening

2 days after 5 days after Before Injury 12 days after

Right Left Right Left Right Left

43% diff Tc 17% diff Tc 5% diff Tc Day 1 Day 14 Day 21

Evaluate progress. Best moment to resume competition?

Muscle Tone Graph Contraction Time

Right Left Right Left Right Left Right Left Right Left Right Left Right Left Right Left Right Left

RF VL VM

Knee Assymetry. 4 days after surgery

59% 79% 53%

Intermuscular Coordination

Week 1 Week 2 Week 3 Week 4 Week 5 Week 6

40 35 30 25 20 15

RF VM VL BF

TMG Screening

Pro Basketball Player Right Thigh Contraction Speed Contraction Time

slide-12
SLIDE 12

5/12/2012 12 Muscular Balance “Monitor Sequential changes in muscle function after an injury”

…what are the experts saying?

slide-13
SLIDE 13

5/12/2012 13

Coaching and performing in the competitive arena is real, three dimensional, beautifully random and

  • chaotic. Numbers by themselves are
  • ne-dimensional and without context.

High performance demands a delicate balance between the qualitative and the quantitative. Don’t believe the moneybull.

Vern Gambetta Functional Path Training Blog April 5 2012

"Lack of published research should never deter clubs from using technology to monitor players and performance. Clubs should however, ensure the data they collect is both reliable and valid, at least for their playing group. This can be difficult in such an applied environment but it’s essential that these tools are used in a robust environment in order to assess their true effectiveness."

Darren Burgess Head of Sport Science Liverpool FC Leaders in Performance Interview April 5 2012

Training monitoring becomes a useful thing to do ONLY if guides practice and informs the coaching process. Otherwise it becomes just a data collection exercise. I have seen many S&C coaches use a variety of tools and tests and despite the fact they have some nice continuous data it is clear that such data did not affect practice as training programs continued in the same way despite the information available on training load and some effects.

Marco Cardinale Head of Sport Science & Research BOA www.marcocardinale.blogspot.com September 2010

slide-14
SLIDE 14

5/12/2012 14

Fergus Connolly Sport Science Consultant Twitter February 20 1012

…so Monitoring…final thoughts

Importance of technology Never forget the human factor Time is limited…use it wisely Ensure reliability throughout the process Generate new information constantly Recovery…recovery…recovery! Achieve better results through simplicity Timeline: look back in order to move forward Enhance, modify and quantify your interventions

Muchas Gracias!

Thank You!

  • E. josedelvalle23@hotmail.com
  • T. @jfernandez__