SLIDE 1
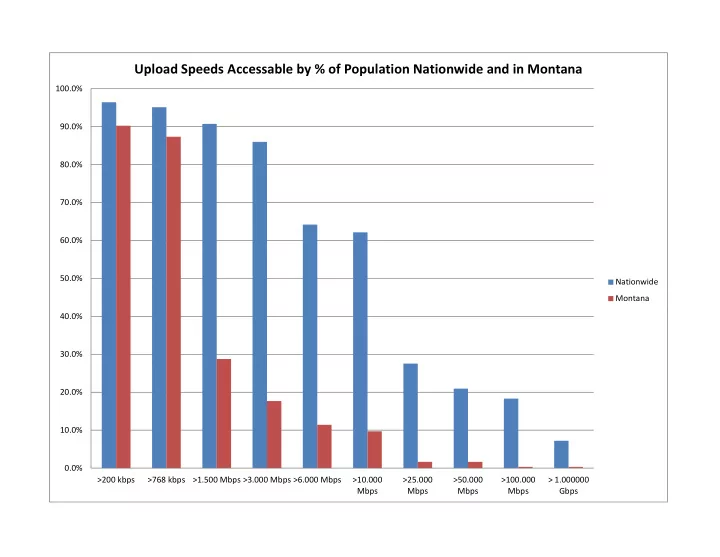
50.0% 60.0% 70.0% 80.0% 90.0% 100.0%
Upload Speeds Accessable by % of Population Nationwide and in Montana
Nationwide Montana 0.0% 10.0% 20.0% 30.0% 40.0% >200 kbps >768 kbps >1.500 Mbps >3.000 Mbps >6.000 Mbps >10.000 Mbps >25.000 Mbps >50.000 Mbps >100.000 Mbps > 1.000000 Gbps
SLIDE 2
40.0% 50.0% 60.0% 70.0% 80.0% 90.0% 100.0%
Wireline Download Speeds Accessable by % of Population Nationwide and in Montana
Nationwide Montana 0.0% 10.0% 20.0% 30.0% >768 kbps Download & 200 kbps Upolad >3 Mbps Download & 768 kbps Upolad >768 kbps >1.5 Mbps >3 Mbps >6 Mbps >10 Mbps >25 Mbps >50 Mbps >100 Mbps > 1 Gbps
SLIDE 3
40.0% 50.0% 60.0% 70.0% 80.0% 90.0% 100.0%
Wireless Download Speeds Accessable by % of Population Nationwide and in Montana
Nationwide Montana 0.0% 10.0% 20.0% 30.0% >768 kbps Download & 200 kbps Upolad >3.000 Mbps Download & 768 kbps Upolad >768 kbps >1.500 Mbps >3.000 Mbps >6.000 Mbps >10.000 Mbps >25.000 Mbps >50.000 Mbps >100.000 Mbps > 1.000000 Gbps
SLIDE 4
50.0% 60.0% 70.0% 80.0% 90.0% 100.0%
Wireless Upload Speeds Accessable by % of Population Nationwide and in Montana
Nationwide Montana 0.0% 10.0% 20.0% 30.0% 40.0% >200 kbps >768 kbps >1.500 Mbps >3.000 Mbps >6.000 Mbps >10.000 Mbps >25.000 Mbps >50.000 Mbps >100.000 Mbps > 1.000000 Gbps
SLIDE 5
90.0% 88.8% 99.4% 85.0% 68.3% 96.6% 50.0% 60.0% 70.0% 80.0% 90.0% 100.0%
Technology Accessable by % of Population Nationwide and in Montana
Nationwide Montana 25.4% 3.4% 0.0% 10.0% 20.0% 30.0% 40.0% DSL fiber cable wireless
SLIDE 6
32.4% 36.9% 58.9% 30.0% 40.0% 50.0% 60.0% 70.0%
Number of Wireline Providers Accessable by % of Population Nationwide and in Montana
Nationwide Montana 3.0% 8.8% 13.7% 3.6% 1.3% 0.4% 0.1% 7.2% 26.9% 6.8% 0.1% 0.0% 0.0% 0.0% 0.0% 0.0% 10.0% 20.0% 30.0% 1 2 3 4 5 6 7 8
SLIDE 7
79.9% 87.8% 50.0% 60.0% 70.0% 80.0% 90.0% 100.0%
Education Achieved by % of Population Nationwide and in Montana
High School Graduate Bachelor Or Greater 24.8% 25.5% 0.0% 10.0% 20.0% 30.0% 40.0% Nationwide Montana
SLIDE 8
$58,811 $47,985
$30,000 $40,000 $50,000 $60,000 $70,000
Median Income
$0 $10,000 $20,000 $30,000 Nationwide Montana
SLIDE 9
15.0% 20.0% 25.0% 30.0% 35.0%
Income Distribution by % of Population Nationwide and in Montana
Nationwide Montana 0.0% 5.0% 10.0% 15.0% BelowPoverty Less Than $25K Between $25K to $50K Between $50K to $100K Between $100K to $200K Greater $200K
SLIDE 10 84.0
40.0 50.0 60.0 70.0 80.0 90.0
Population Density (persons per square mile)
7.0
20.0 30.0 40.0 Nationwide Montana