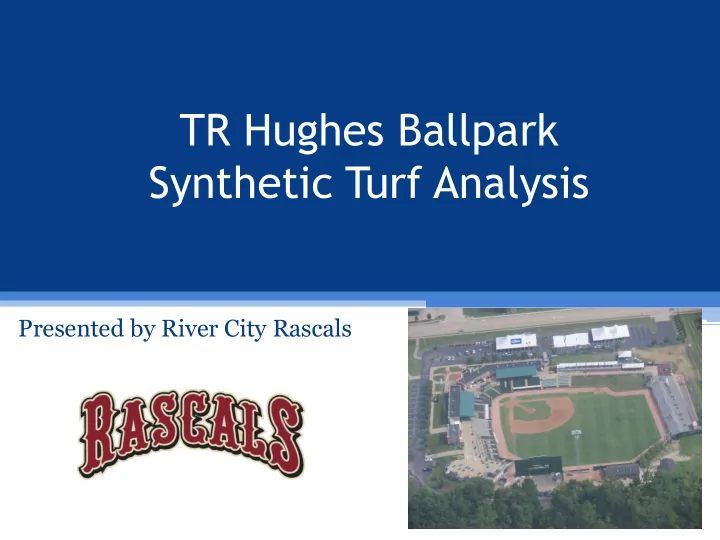

TR Hughes Ballpark Synthetic Turf Analysis Presented by River City Rascals
TR Hughes Ballpark Information • Opened in 1999 • Capacity of 5,150 • Home to the River City Rascals of the independent Frontier League • Lifetime stadium attendance in excess of 2 million • Has hosted HS, college, and pro baseball, concerts, national TV shows, and presidential rallies among many other things
The Early Years and Where We Are Now 1999-2007 2008-Current • Rascals Attendance: 663,576 • Rascals Attendance: 1.28 • Rascals perform all field and million most stadium maintenance • City of O’Fallon performed • Attendance for Rascals games year round field and stadium has decreased under 100,000 in maintenance on the ballpark most seasons (3 person field crew, 8-10 • Extra events at the stadium are game day staff) much more frequent and are a key revenue driver for the • Attendance for Rascals games Rascals organization due to the regularly exceeded 150,000 increase in stadium/field each season maintenance • Extra events at the stadium • Field usage has increased over were not used as a revenue 100% in the last 5 years driver
The Trends for Pro Sports Facilities • 6 of 13 Frontier League stadiums have synthetic turf fields; at least 3 are considering installing within 2-3 years • More than 8,000 multi-purpose synthetic fields have been installed in North America • Cities and municipalities are moving to synthetic fields not only for monetary savings, but to save water and cut down on use of pesticides/chemicals
How Do WE Benefit? The Basics. • Synthetic turf fields are typically utilized for about 3,000 hours of play per year, with no "rest” required. In addition, synthetic turf maintenance costs are two to three times less than natural turf, since no mowing, irrigation or chemicals are needed. Because of its consistent availability, a synthetic turf field is also a reliable source of rental revenue for schools, teams, and communities. • There are generally between 0-1 rainouts per season on synthetic turf; there were 7 rainouts for Rascals games at TR Hughes Ballpark during the 2014 season
Costs to Install/ Types of Turf Fields Multi-Sport Baseball Only • Approx. $1 million • Approx. $750,000 • Field dimensions would allow • Field dimensions would limit for soccer, lacrosse, rugby, sports to only baseball, but concerts, and other non- still make concerts possible baseball events • Initial cost would be lower • Attract more events and a • Construction time would be wider demographic lessened • Allow city to add several other • Less wear and tear from less fields in a current high demand market events • Turf replacement after 8-10 • Turf replacement after 10-15 years/ approx. cost $450,000 years/ approx. cost $400,000
Turf vs Grass Offseason Calendar Gateway Grizzlies March RC Rascals March 2014- 2014- 22 events 9 events (2 rained out) 1-Mar Saturday 2-Mar Sunday 3-Mar Monday 4-Mar Tuesday 5-Mar Wednesday 6-Mar Thursday 7-Mar Friday 8-Mar Saturday BASEBALL 11:00 AM 6:00 PM SLU BASEBALL (DH) 9-Mar Sunday BASEBALL 11:00 AM 3:00 PM SLU BASEBALL 10-Mar Monday 11-Mar Tuesday 12-Mar Wednesday 13-Mar Thursday 14-Mar Friday BASEBALL 4:00 PM 9:00 PM SLU BASEBALL 15-Mar Saturday BASEBALL 11:00 AM 7:00 PM SLU BASEBALL (DH) 16-Mar Sunday 17-Mar Monday 18-Mar Tuesday 19-Mar Wednesday 20-Mar Thursday 21-Mar Friday BASEBALL 1:00 PM 7:30 PM CHRISTIAN HIGH JV TOURNAMENT 22-Mar Saturday BASEBALL 9:00 AM 7:30 PM CHRISTIAN HIGH JV TOURNAMENT 23-Mar Sunday 24-Mar Monday 25-Mar Tuesday BASEBALL 3:00 PM 6:30 PM NORTH TECH HIGH BASEBALL 26-Mar Wednesday BASEBALL 4:30 PM CHRISTIAN HIGH BASEBALL 27-Mar Thursday 28-Mar Friday BASEBALL 3:30 PM CHRISTIAN HIGH BASEBALL 29-Mar Saturday BASEBALL 30-Mar Sunday 31-Mar Monday
Revenue Generation/ Expense Savings • $50,000 increase in Rascals yearly lease payment as soon as turf is installed • Lease runs for at least 8 more seasons, generating a total increase of at least $400,000 in revenue for City of O’Fallon • Water cost- $1,348/ year saved by city • We have already gathered several commitments from colleges to play on our turf field
Economic Impact for City of O’Fallon • In it’s most basic understanding, we know that bringing more events to TR Hughes Ballpark means more people entering our community and generating tax revenue • - Potential Total # of Additional Events in 2015 (7 Rascal Games + 47 Others) = 56 • - Potential Total # of Additional Attendees in 2015 (14,000 for Rascals + 20,000 for Others) = 34,000 • - Average Spending per person @ Rascals = $16.91 (Tickets, concessions, apparel, etc.) • - Average Spending per person @ Others = $3.29 (Concessions Only) • This is internal spending only • External revenues will impact hotels, restaurants, convenience stores, etc. in O’Fallon
Recommend
More recommend