
SLIDE 1
THIS IS YOUR PRESENTATION TITLE 1. Challenge DEFINING OUR - - PowerPoint PPT Presentation
THIS IS YOUR PRESENTATION TITLE 1. Challenge DEFINING OUR PROBLEM SPACE Questions we asked ourselves in the beginning: How can we improve the experience in AVs to make them feel more safe, reliable, and accessible for all types of
DEFINING OUR PROBLEM SPACE
Questions we asked ourselves in the beginning: ➔ How can we improve the experience in AVs to make them feel more safe, reliable, and accessible for all types of riders? ➔ How can we take into consideration the jobs of professional drivers? ➔ How do we ease the transition from semi-autonomous to fully-autonomous vehicles?
D4SD CHALLENGE & TOPIC
Problem: AVs aren't completely reliable – they still expect the rider to takeover in certain difficult conditions. How can we allow all types of riders to travel freely in AVs without having to worry about a possible takeover event?
★ 1 in 7 people in the US (57 million) have a disability, and for a large subset of the disabled community, transportation remains inaccessible and unreliable for their needs. ★ AV legislation is being discussed, but not so much as to how AVs can accommodate riders with disabilities. ★ Ride-sharing companies are not completely reliable for riders with disabilities.
INTERVIEWING AT PB, MISSION VALLEY, VA HOSPITAL
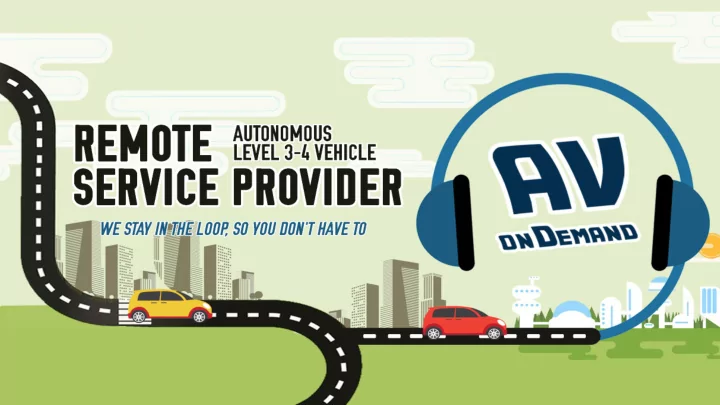
OUR SOLUTION
Solution: AV onDemand eliminates all rider takeover responsibilities and improves accessibility within autonomous vehicles by connecting each vehicle to a service provider to remotely handle the AV whenever the situation arises.
▸ Rider enters and confirms destination ▸ A service provider can be summoned throughout the entire trip
To the right: example of rider UI
▸ Service providers given 360 view of surrounding environment ▸ System status indicates AVs confidence to maneuver through environment ▸ Service providers work from a remote location and view a system status for all autonomous vehicles currently dispatched on rides with ride sharing companies.
Day in the Life: Service Provider
Place your screenshot here
HAZARD ZONE DETECTION
Machine learning helps perform comparative analysis that calculates hazard zone percentage to determine whether vehicle may be in danger i.e. construction zone or dirt roads
To the right: example of service provider UI showing different cars that have increasing hazard zone percentages over time
Place your screenshot here
AV & SERVICE PROVIDER COLLABORATION
Place your screenshot here
AV & SERVICE PROVIDER COLLABORATION (CLOSEUP)
Closeup of Manual Override
Setting paths, boundaries, and restrictions for the AV to safely follow
MANUAL OVERRIDE MODE - FAQ
Why trajectory arrows? 1. Reduce takeover responsibilities 2. UI is uniform for all cars 3. Increased depth perception Why not create a driving simulator? 1. Requires precise calibration 2. Capture-to-Display Latency 3. Different model cars handle uniquely
Testing and Feedback
Testing Rider UX
AV gives audio notifications to alert “blind” passenger of its arrival Approximately 5 minute trip with construction zone detected
Findings for Rider Experience
Riders were comfortable and relaxed Communication mostly helpful but
Problems:
difficulty finding vehicle
could explain why they were relaxed
Testing and Feedback
Testing Service Provider UX
Tested to see if service providers could provide smart choice in short amount of time Easiest way we could think of to test UI Problems:
place stickers in the correct spot as video moves
Testing and Feedback
Service Provider Ratio
Honda service help line took 7 minutes to answer
Same person answered the five of us successively Pointed out that SP ratio should be 1:1
Implementation of Existing Technology
The technology needed to implement AV onDemand already exists ➔ Capture-to-Display technology ◆ Satellite data transfer ➔ Machine learning and big data acquisition ➔ Lidar detectors
Capture-to-Display Latency Capture-to-Display Latency
Time it takes to compress, decompress, then display video to remote location
shows a CTD of 200ms delay
reach a minimum of 150ms
25mph zone
Capture-to-Display Latency
Understanding Big Data
Uber and Lyft test AVs in urban environments to identify where they fail Data storage can be called upon in real time to verify if an AV is in a predetermined hazard zone
AV onDemand eliminates passenger takeover responsibilities required in level 3 to 4 AVs, increasing mobility for the physically, cognitively, and visually disabled.
Mobility for Individuals with Disabilities Enhanced Rider Freedom
AV onDemand’s service extends to all ride-share customers who don’t want to worry about rider responsibility.
We put a fake service provider job listing on Indeed.com and received
New Employment Opportunities AV onDemand creates a new job market for professional drivers who would be displaced by AVs. Individuals with disabilities who demonstrate the capacity to perform service provider duties may also be employed.
Developing a Robust Service Provider UI
What we have: Alex on roof with phones taped together Snapchat stickers to indicate boundaries and paths 2D arrow projectiles
Developing a Robust Service Provider UI
What we want:
Camera with 360 view Drag and drop indicators onto real time video for manual takeover
Computer program that allows the Service Provider to actually control the car Calculate the perfect ratio of service providers to AVs
How to do:
Access to an AV Computer programmers and mechanics Gather data for hazard percentages More time More testing $$$
Thank you!!
References: http://www.ti.com/lit/wp/spry301/spry301.pdf Calculating Latency U.S. Census Bureau, American Community Survey Bureau of Transportation Statistics, “Transportation Difficulties Keep Over Half a Million Disabled at Home,” April 2003.