
SLIDE 1
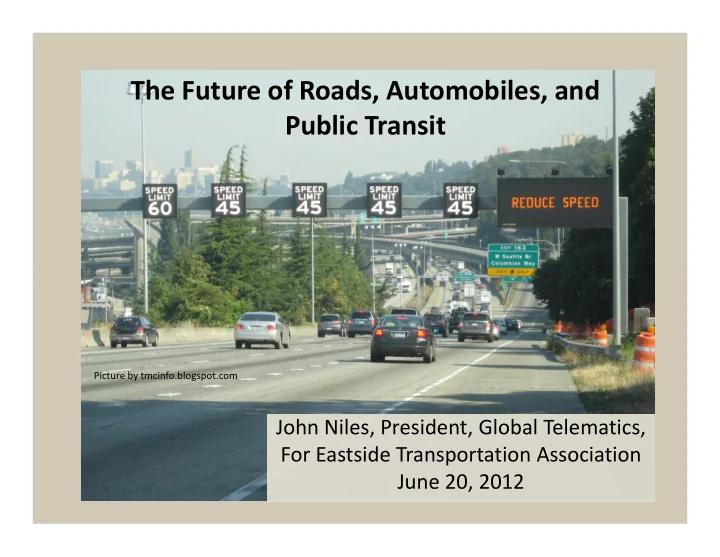
The Future of Roads, Automobiles, and Public Transit
John Niles, President, Global Telematics, For Eastside Transportation Association June 20, 2012
Picture by tmcinfo.blogspot.com
The Future of Roads, Automobiles, and Public Transit Picture by - - PowerPoint PPT Presentation
The Future of Roads, Automobiles, and Public Transit Picture by tmcinfo.blogspot.com John Niles, President, Global Telematics, For Eastside Transportation Association June 20, 2012 Mode Shares, Puget Sound Region, 2006 Transit 3% Bike/Walk
Picture by tmcinfo.blogspot.com
Bike/Walk 11% Transit 3% Solo Driving
Shared Ride 43% Solo Driving 43%
Data source: Puget Sound Regional Council, Metropolitan Transportation Plan
Map source: PSRC, Destination 2040
Map source: PSRC, Destination 2040
Forecast 2040 residential & job growth
Data for both charts from: Puget Sound Regional Council. Motorized land travel only.
Official Approved Plan
Source: Puget Sound Regional Council
Source:
Source: PSRC Household Travel Survey
25
5 10 15 20 2000 2040 Percentage
Source: PSRC Vision 2040 Draft Supplemental EIS, page II-29
Source: http://www.earthcam.com/clients/britishcolumbia/portmann/
Source: Camera phone video by John Niles in Saigon, 2011
Posted at whitehouse.gov
Source: Global Telematics
Source: Steve Marshall at Center for Advanced Transportation and Energy Solutions
Source: Steve Marshall at Center for Advanced Transportation and Energy Solutions
Photos from the U.S. Navy
Photos from car companies: top row, Ford; bottom row: Nissan and General Motors
Source: Mitsubishi chief engineer David Patterson
Source: Technology Review, January 2012
Source: Volvo http://www.volvocars.com/intl/top/about/news-events/pages/default.aspx?itemid=209
From Mitsubishi chief engineer David Patterson
Source: Connecting Washington Task Force Report
Source: http://www.hcltech.com/automotive/insurance-telematics
Source: Presentation by Battelle on the Minnesota VMT charging pilot program.
Source: Presentation by Battelle on the Minnesota VMT charging pilot program.
Source: PSRC Destination 2040 Plan
Magazine ad from the 1950s
Source: Professor Steve Underwood, Connected Vehicle Proving Center University of Michigan - Dearborn
The Google autonomous vehicle
Source: Professor Steven Shladover, UC Berkeley
Source: WSDOT
Picture by tmcinfo.blogspot.com
$4.80 $5.39
Expenditureper passenger mile, 2000-2007
OperatingCost Per Passenger Mile Capital Cost Per Passenger Mile Total Expenditure Per Passenger Mile
$0.14 $0.67 $0.45 $0.43 $0.60 $0.06 $0.17 $0.69 $1.27 $0.20 $0.85 $1.15 $1.70 Six Regional Vanpool Agencies Six Regional Bus Agencies LightRail* SoundTransit Buses** Sounder Commuter Rail
Source: National Transit Database and Island Transit officials * Datatotaled fromlight rail systemsin San Jose, LosAngeles&Portland ** Excludesdatafor purchased transportation
Data from Mike Ennis at Washington Policy Center
80.0 100.0 120.0
Per Gallon of Diesel
Passenger Miles Per Gallon for King County Metro Bus Varies by How Many Passengers Ride on a Route
0.0 20.0 40.0 60.0 0.00 10.00 20.00 30.00 40.00 50.00 60.00 70.00 80.00 90.00
Passenger Miles Per G Rides Per Trip on the Route
Average Passenger Miles per Gallon is 43.9
Data Source is King County Metro Transit spreadsheet of performance by route. Calculated 3.06 revenue miles per gallon of diesel is an average calculated from system wide average in 2009. Chart by John Niles, Center for Advanced Transportation Solutions.