
SLIDE 1
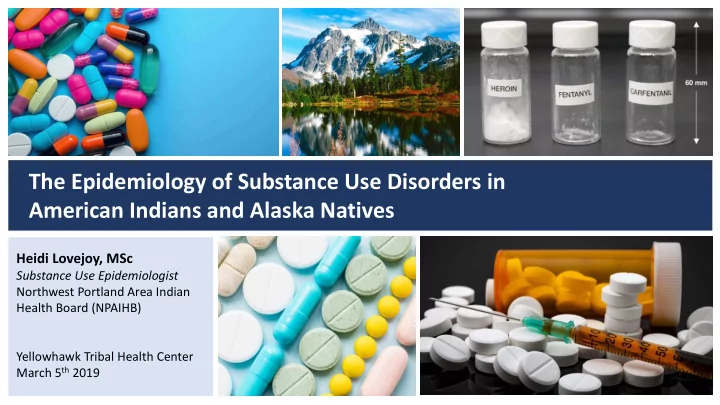
The Epidemiology of Substance Use Disorders in American Indians and Alaska Natives
Heidi Lovejoy, MSc
Substance Use Epidemiologist Northwest Portland Area Indian Health Board (NPAIHB) Yellowhawk Tribal Health Center March 5th 2019
The Epidemiology of Substance Use Disorders in American Indians and - - PowerPoint PPT Presentation
The Epidemiology of Substance Use Disorders in American Indians and Alaska Natives Heidi Lovejoy, MSc Substance Use Epidemiologist Northwest Portland Area Indian Health Board (NPAIHB) Yellowhawk Tribal Health Center March 5 th 2019 National
Heidi Lovejoy, MSc
Substance Use Epidemiologist Northwest Portland Area Indian Health Board (NPAIHB) Yellowhawk Tribal Health Center March 5th 2019
Northwest Portland Area Indian Health Board
5 10 15 20 25 Deaths Per 100,000 Year
Age Adjusted Rates per CDC Wonder Data
21.7 .7 13.1 .1 10.1 .1 6.1 .1
Northwest Portland Area Indian Health Board
5 10 15 20 25 Deaths Per 100,000 Year
Age Adjusted Rates per CDC Wonder Data
21.7 .7 13.1 .1 10.1 .1 6.1 .1
National Public Health Emergency Declared in 2017
Northwest Portland Area Indian Health Board
Age Adjusted Rates per CDC Wonder Data
5 10 15 20 25 30
Deaths Per 100,000
Year White (Non-Hispanic) National Average American Indian/ Alaska Native
21.7 .7 27.5 .5 16.2 .2
Northwest Portland Area Indian Health Board
Northwest Portland Area Indian Health Board
National Age Adjusted Rates per CDC Wonder Data, Washington Age Adjusted Rates per Washington State Death Certificates
5 10 15 20 25
Deaths Per 100,000
Year Washington State National Average
15.4 .4 21.7 .7
Northwest Portland Area Indian Health Board
Age Adjusted Rates per Washington State Death Certificates
10 20 30 40 50
Deaths Per 100,000
Year Washington State
15.4 .4
American Indian/ Alaska Native White (Non-Hispanic)
15.3 .3 43.1 .1
10 20 30 40 50
Deaths Per 100,000
Year
Northwest Portland Area Indian Health Board
Age Adjusted Rates per Washington State Death Certificates, National per CDC WONDER
Washington State American Indian/ Alaska Native
43.1 .1
National Average Considered a Public Health Emergency
21.7 .7
national rate
Northwest Portland Area Indian Health Board
Northwest Portland Area Indian Health Board
Age Adjusted Rates per Washington State Death Certificates, 3-Year Rolling Averages
10 20 30 40 50
Deaths Per 100,000 Year
31.5 .5 15.3 .3 44.6 .6 10.2 .2
AI/AN, All OD AI/AN, Opioid OD White, All OD White, Opioid OD
Northwest Portland Area Indian Health Board
Age Adjusted Rates per Washington State Death Certificates, 3-Year Rolling Averages
Prescription Opioid Multiple Opioids Heroin Methadone 5 10 15 20 2001 2002 2003 2004 2005 2006 2007 2008 2009 2010 2011 2012 2013 2014 2015 2016 Deaths per 100,000 Year
8.7 .7 7.6 .6 14.4 .4 1.8 .8
American Indian/Alaskan Native
Morphine Codeine Hydrocodone Oxycodone Methadone Etc
Northwest Portland Area Indian Health Board
Age Adjusted Rates per Washington State Death Certificates, 3-Year Rolling Averages
5 10 15 20
2001 2002 2003 2004 2005 2006 2007 2008 2009 2010 2011 2012 2013 2014 2015 2016 2001 2002 2003 2004 2005 2006 2007 2008 2009 2010 2011 2012 2013 2014 2015 2016
Deaths per 100,000 Year American Indian/Alaska Native White (Non-Hispanic)
Prescription Multiple Heroin Methadone Prescription Multiple Heroin Methadone
Northwest Portland Area Indian Health Board
Age Adjusted Rates per Washington State Death Certificates, 3-Year Rolling Averages
5 10 15 20 2001 2003 2005 2007 2009 2011 2013 2015 Deaths per 100,000 Year Methamphetamine & Psychostimulants Cocaine Remove Opioids
3.4 .4 15.5 .5
American Indian/Alaskan Native No Opioid Involved in Death 5 10 15 20 2001 2003 2005 2007 2009 2011 2013 2015 Methamphetamine & Psychostimulants Cocaine
0.7 .7 6.6 .6
American Indian/Alaskan Native
Northwest Portland Area Indian Health Board
0% 10% 20% 30% 40% 50% 60% 70%
AI/AN Female AI/AN Male White Female White Male Percent
Percent of Deaths per Washington State Death Certificates, 1999-2016
5 10 15 20 25 30 Rate (per 100,000) Year
Northwest Portland Area Indian Health Board
Age Adjusted Rates per Washington State Death Certificates, 3-Year Rolling Averages 1999-2016
AI/AN Male White Male AI/AN Female White Female
19.6 .6 9.2 .2 25.0 .0 6.0 .0
Northwest Portland Area Indian Health Board
Age Adjusted Rates per Washington State Death Certificates, 1999-2016
0.7 24.9 48.8 71.0 44.8 19.4 4.9 35.5 52.9 77.8 61.5 27.3
10 20 30 40 50 60 70 80 90 0-19 20-29 30-39 40-49 50-59 60+ Rate (per 100,000) Age Group American Indian/Alaska Native Male Female
Northwest Portland Area Indian Health Board
Age Adjusted Rates per Washington State Death Certificates, 1999-2016
AI/AN Male AI/AN Female
0.7 24.9 48.8 71.0 44.8 19.4 4.9 35.5 52.9 77.8 61.5 27.3 0.9 8.4 15.4 24.2 22.9 7.5 1.6 19.7 24.9 34.4 27.8 8.0
10 20 30 40 50 60 70 80 90 0-19 20-29 30-39 40-49 50-59 60+ Deaths per 100,000 Age Group White Female White Male
Northwest Portland Area Indian Health Board
Northwest Portland Area Indian Health Board
Process:
the other
Death certificates National Tribal Registry
NTR
AI/AN AI/AN AI/AN White
AI/AN White AI/AN
10 20 30 40 50 Deaths per 100,000
Northwest Portland Area Indian Health Board
AI/AN Race Corrected AI/AN Race Un-Corrected Up to 20% underrepresentation in AI/AN overdose death rate No difference in rates White (non-Hispanic) Race Corrected and Un-Corrected
10 20 30 40 50 Deaths per 100,000
2016 AI/AN Drug Overdose Death Rate in Washington
Northwest Portland Area Indian Health Board
AI/AN
Not Race- Corrected Race- Corrected NPAIHB Reporting Agency WA DOH CDC
10 20 30 40 50 Deaths per 100,000
2016 AI/AN Drug Overdose Death Rate in Washington
Northwest Portland Area Indian Health Board
AI/AN
Not Race- Corrected Race- Corrected NPAIHB WA DOH Reporting Agency State data reports 20% lower CDC
10 20 30 40 50 Deaths per 100,000
2016 AI/AN Drug Overdose Death Rate in Washington
Northwest Portland Area Indian Health Board
AI/AN
Not Race- Corrected Race- Corrected NPAIHB WA DOH CDC Reporting Agency National data reports 30% lower
Northwest Portland Area Indian Health Board
Age Adjusted Rates per CDC Wonder Data
5 10 15 20 25 30
Deaths Per 100,000
Year White (Non-Hispanic) National Average American Indian/ Alaska Native
21.7 .7 27.5 .5 16.2 .2
AI/AN rates may be higher nationally?
Northwest Portland Area Indian Health Board
Substance Use Epidemiologist Northwest Portland Area Indian Health Board HLovejoy@NPAIHB.org
Northwest Portland Area Indian Health Board
Northwest Portland Area Indian Health Board
Scenario: Group A: 1,000 people 50 people die of a disease in both groups. Group B: 100 people Group A: 50/1,000 = 5% died. Not good. To compare across groups with different sized populations Group B: 50/100 = 50% died. Really bad!! Same number of deaths. This is why we use rates – to compare across populations