
SLIDE 1
The Dark Energy Survey
OUTLINE
- Introduction
- DES & DECam
- Observing Efficiency &
Results for DES 1st and 2nd Seasons
- The Path to DE Science
- Recent Publications
- Summary
Tom Diehl (DES Operations Scientist) Fermi National Accelerator Laboratory June 24, 2015
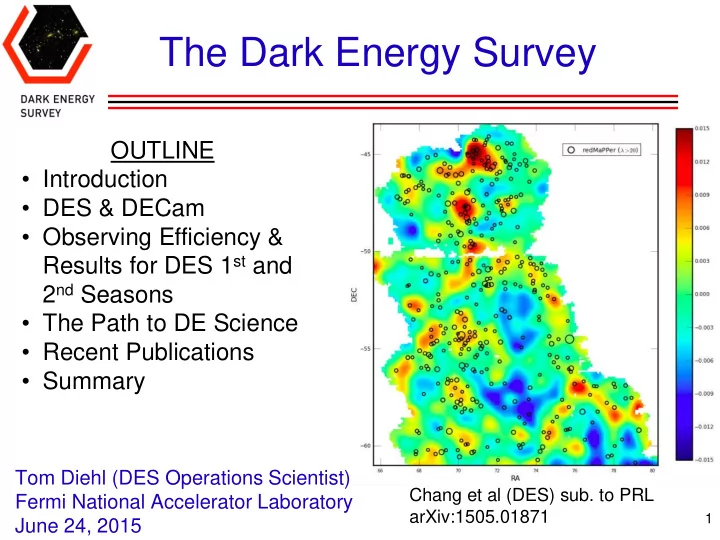
Chang et al (DES) sub. to PRL arXiv:1505.01871
1