
SLIDE 1
Modeling Adult Visual Function
- Dr. James A. Bednar
jbednar@inf.ed.ac.uk http://homepages.inf.ed.ac.uk/jbednar
CNV Spring 2015: Modeling adult function 1
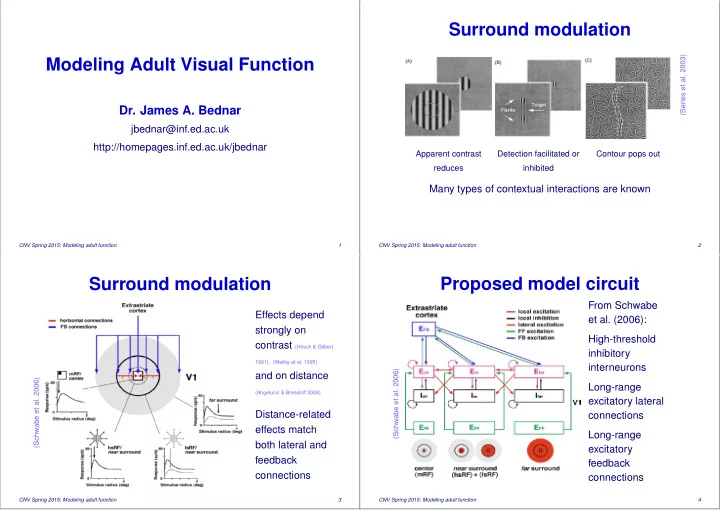
Surround modulation
Apparent contrast reduces Detection facilitated or inhibited Contour pops out
(Series et al. 2003)
Many types of contextual interactions are known
CNV Spring 2015: Modeling adult function 2
Surround modulation
(Schwabe et al. 2006)
Effects depend strongly on contrast (Hirsch & Gilbert
1991), (Weliky et al. 1995)
and on distance
(Angelucci & Bressloff 2006)
Distance-related effects match both lateral and feedback connections
CNV Spring 2015: Modeling adult function 3
Proposed model circuit
(Schwabe et al. 2006)
From Schwabe et al. (2006): High-threshold inhibitory interneurons Long-range excitatory lateral connections Long-range excitatory feedback connections
CNV Spring 2015: Modeling adult function 4