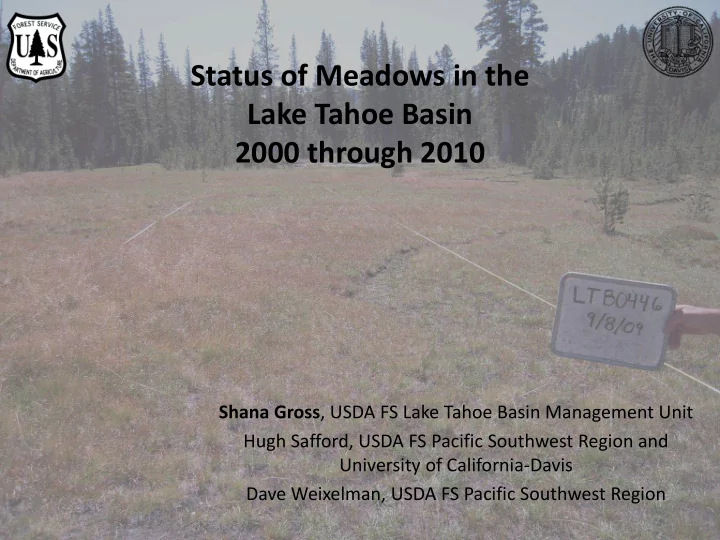

Status of Meadows in the Lake Tahoe Basin 2000 through 2010 Shana Gross , USDA FS Lake Tahoe Basin Management Unit Hugh Safford, USDA FS Pacific Southwest Region and University of California-Davis Dave Weixelman, USDA FS Pacific Southwest Region
37 Meadows – 66 plots
25 m 15 m 12.5 m 10 m 5 m 0 m
Frequency % of plots occupied by a species • Comparable with identical size/shape plots • Sensitive to changes in spatial arrangement • Monitor invasion of undesirable species • Measures stable throughout growing 20 cm season • Nondestructive • 2 Can be evaluated quickly • Repeatable – no/low observer bias 1 20 cm 3 10 cm 5 cm 4
What did we analyze? Field Data • Community Data Basal Vegetation Litter correlated with Percent Ground Bare Soil Cover Gravel Environmental Data Rock Cryptogram • Diversity Depth to Mottles Hydrologic Depth to Saturation Indicators • Plant functional group Rooting Depth Number of Invasive Species scorecards Office Data – Vegetation Wetland Vegetation Wetland Score Meadow Scorecard Scores Ecosystem Functional Score Score Annual Precipitation – Ecosystem Function PRISM Climate Average Annual Maximum Group, OSU Temperature Score 166.5.119.253 Average Annual Minimum Temperature Elevation
Functional Groups Groupings of plant species which perform similarly in an ecosystem based on a set of common functional traits related to plant species response to disturbance and stressors in meadow. WHY WE USED • Consistent for all species, • Vegetation Wetland Score including new species – FWS Wetland Ratings • Objective – Obligate, Facultative, Upland • Based on ecology of each • Ecosystem Function Score species – Height of species • Consistent with scientific – Rhizomatous/non- literature rhizomatous • Model species and – Nitrogen Fixing community response – Annual/Perennial
Ecosystem Function Score CSR All Annuals R Forbs, <1 m, non rhizomatous R Forbs, <1 m, rhizomatous S Forbs, >1 m, non rhizomatous S Forbs, >1 m, rhizomatous C All N-fix herbaceous S Grasslikes, rhizomatous, all heights C Grasslikes, non rhizomatous, <50 cm S Grasslikes, non rhizomatous, >50 cm C Grasses, <70 cm S Grasses, >70 cm C Shrubs and trees C Nonvascular perennial S R: Forbs, <1m, S: Forbs, <1m, rhizomatous C: Grasslikes, rhizomatous, non rhizomatous all heights Christopher Chrisite - CalPhotos Christopher Christie - Calphotos Kier Morse - CalPhotos Castilleja miniata Aster occidentalis * Juncus arcticus *
Species Richness Number of Species and Families Change in Species Richness By Year: 2000 to 2011 2004 to 2009 30 species were unique to 2004 79 species were unique to 2009 • 54% R (n=43) • 19% S (n=15) • 27% C (n=21)
What do our meadows look like? Frequency of Species Number of Species Averaged Year Averaged Year Nonvascular Forb Grasslike Grass Shrub Tree Christopher Christie - Calphotos LTBMU FS Steve Matson – CalPhotos LTBMU FS Kier Morse - CalPhotos Julie Nelson - CalPhotos Sphagnum sp.* Aster occidentalis * Juncus arcticus * Salix geyeriana * Deschampsia Pinus contorta * cespitosa *
Meadow 04/05 09 Encroachment of Pinus contorta ? Airport x Big 1 x Blackwood Creek x Cookhouse 3 x x Cookhouse 4 x Cookhouse 5 x Ginny Lake x x Grass Lake 1 x x Grass Lake 3 x Haypress x x Hell Hole 1 x x Hell Hole 2 x McFaul Creek x Meiss 1 x Osgood 1 x Round Lake 1 x x Round Lake 2 x Sky x Star Lake x Tahoe 1 x x McNemar’s Test: 2004 to 2009 p = 0.03 Tahoe 2 x x Ward Creek x
What Environmental Variables Influence Community Composition? • Vegetation wetland score • Elevation • Depth to Saturation • Precipitation • Maximum temperature • Litter cover • Soil cover • Cryptogram cover
wetland rating = 50 + .5 *(OBL) - .5 * (FACU+UPL) condition score = 50 + .5 *(C) - .5 * (R)
Cookhouse
Ecological Score Wetland Score 2 – Low 3 – Dry 58 – Medium 49 – Moist 6 - High 14 - Wet
In Summary..……Future Plans • Increased diversity 2004 • Re-measure 2014 to 2009 • Identify meadows for • Highest diversity - forbs restoration – – Conifer removal • Highest frequency - – Introduction of fire grasslikes • Monitor meadows with • LTBMU Meadows channel restoration – Medium function – High Meadow – Moist – Upper Truckee • Increased conifers 2004 to 2009
Acknowledgements • Erik Frenzel • Blake Engelhardt • Sarah Muskopf Field Crew • Cristina McKernan • Emily Miller • Holly Trenton • Lisa Orr • Kate Milch
Recommend
More recommend