Statistics of ionospheric disturbances and their correlation with - - PowerPoint PPT Presentation

statistics of ionospheric disturbances and their
SMART_READER_LITE
LIVE PREVIEW

Statistics of ionospheric disturbances and their correlation with - - PowerPoint PPT Presentation

Statistics of ionospheric disturbances and their correlation with GNSS positioning errors at high latitudes Knut Stanley Jacobsen and Michael Dhnn Norwegian Mapping Authority Published in Journal of Space Weather and Space Climate, Vol. 4


slide-1
SLIDE 1

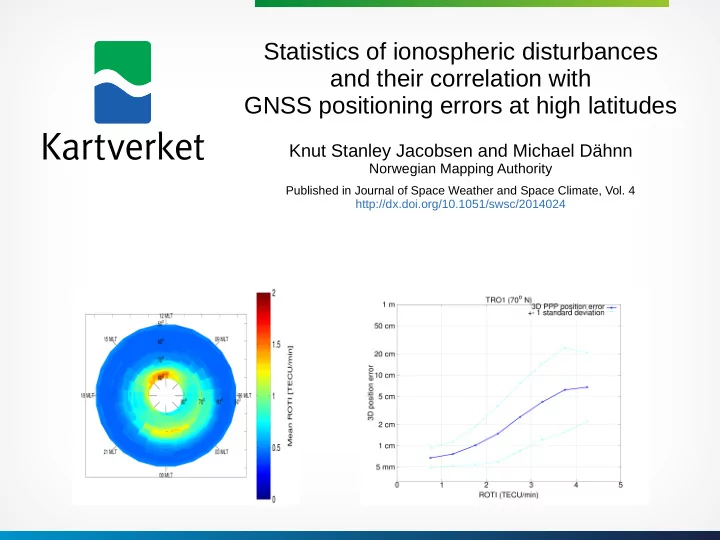
Knut Stanley Jacobsen and Michael Dähnn

Norwegian Mapping Authority

Statistics of ionospheric disturbances and their correlation with GNSS positioning errors at high latitudes

Published in Journal of Space Weather and Space Climate, Vol. 4 http://dx.doi.org/10.1051/swsc/2014024

slide-2
SLIDE 2

Data source

  • 9 GNSS receivers, 1 Hz sample rate
  • Time period: 2012 (the entire year)
slide-3
SLIDE 3

Calculations

Every 5 minutes, for each satellite observed by each receiver, we calculated:

  • ROTI

(A measure of ionospheric disturbance level)

  • Standard deviation of Rate-of-TEC
  • 3D position
  • Calculated using GIPSY

The 3D position error was calculated by taking the difference between the instantaneous values of the coordinate time series and its median value, after removing the linear trend from the coordinate time series by subtracting it's linear fit for the year. Geomagnetic coordinates were calculated for all measurement points, using AACGM.

slide-4
SLIDE 4

Relevant space weather regions at high latitudes

  • The Auroral Oval
  • The Polar Cusp
slide-5
SLIDE 5
  • 10.3 million satellite measurement points
  • 0.94 million receiver coordinates

Amount and distribution of measurements

slide-6
SLIDE 6

Result 1 – ROTI vs Elevation

  • At elevations below 30 degrees, the value of ROTI depends

strongly on elevation. The value of ROTI increases exponentially with the length of the signal path through the atmosphere.

  • At elevations above 40, other effects dominate over the elevation

dependence.

slide-7
SLIDE 7

Result 2 – ROTI occurrence statistics

Mean ROTI all observations included Percentage of observations with ROTI >= 3.5 Percentage of observations with ROTI >= 5

Elevated ROTI values occur mainly in the cusp region and in the nightside auroral oval. Enhanced ROTI values most commonly occur in the cusp region, but when they occur in the nightside auroral oval, they are higher.

(In geomagnetic coordinates)

slide-8
SLIDE 8

Calculations

Characterizing the connection between ROTI and position error

slide-9
SLIDE 9

Result 3 – The connection between ROTI and position error

slide-10
SLIDE 10

Result 3 – The connection between ROTI and position error

ID Latitude

  • Corr. coeff.

b NYAL 78.93 0.46 1.67 NYA1 78.93 0.39 0.75 LYRS 78.23 0.47 0.99 HAMC 70.67 0.66 0.88 TRO1 69.66 0.67 1.02 VEGS 65.67 0.49 0.9 FOLC 64.12 0.41 0.83 HFS4 60.14 0.09 0.13 OPEC 59.91 0.14 0.24 STAS 59.02 0.16 0.31 PosErr3D, 1h = a * e(b * ROTIAvg, 1h)

slide-11
SLIDE 11

Result 4 – Risk of simultaneous disturbance

slide-12
SLIDE 12

Conclusions

  • PPP position error is strongly correlated with ROTI.
  • PPP position error increases exponentially with ROTI.
  • At elevations below 30 degrees, the length of the signal path through

the atmosphere is the dominating factor for the average ROTI value.

  • Elevated ROTI values occur mainly in the cusp region and in the

nightside auroral oval.

  • Enhanced ROTI values most commonly occur in the cusp region, but

when they occur in the nightside auroral oval, they are higher.

  • The risk of having multiple satellites simultaneously disturbed is greater

at higher latitudes.