Session 1B: Computing Performance (S.Y. Jun & D. Elvira) CPU - - PowerPoint PPT Presentation
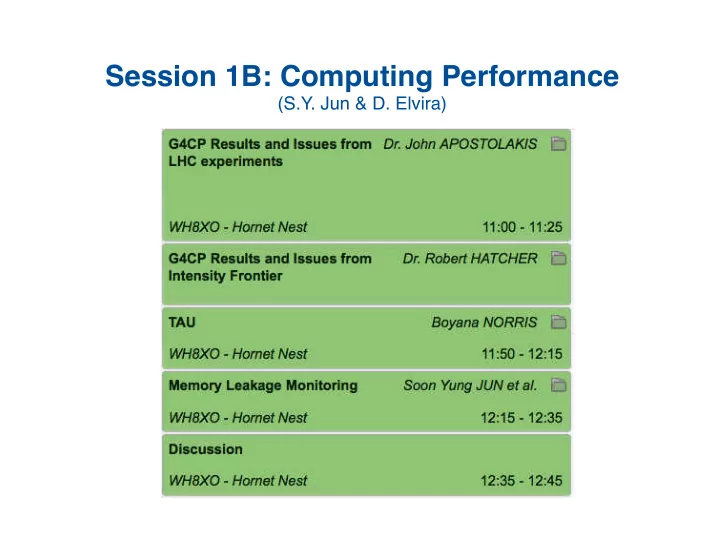
Session 1B: Computing Performance (S.Y. Jun & D. Elvira) CPU Performance: ATLAS&CMS (John Apostolakis) Geant4 Status in CMS 2015 production: 10.0.p02 (sequential), QGSP_FTFP_BERT_EML, ~ 5 billion events (2015) (+ ) CPU
CPU Performance: ATLAS&CMS (John Apostolakis)
Geant4 Status in CMS
- 2015 production: 10.0.p02 (sequential),
QGSP_FTFP_BERT_EML, ~ 5 billion events (2015) (+ )
– CPU
- Technical performance Improvements for Run 2
– Upgrade to 10.0 (~5%) – Russian Roulette (~30%) – CMSSW optimization (~15%) – Library repackaging (~10%)
3
Geant4 Status in CMS
- Multi-threaded Geant4 (10.0p03) is fully integrated with CMS
multi-threaded framework – plan to use it in production 2016
- Performance of CMS MT GEN- SIM (CHEP2015)
– Excellent scaling performance in Time/Event – ~2 GB RSS for 12 single threaded jobs (+200 MB per thread)
4
Geant4 Status in ATLAS
- Integrated Sim. Framework (ISF) use almost all production.
– 9.6 full simulation used in 80% of production (ratio will drop) – Expect move to 10.1 for next campaign (end 2015)
- Stability and production
– Crash rate: ~1.5% failure for jobs of 1,000 events (unacceptable) – The Multi Level Locator has proven to be a weakness
- Hot spots and remedies
– Neutrons take a lot of CPU time. – Might seek to use available biasing features
- Memory – use and churn
– Memory consumption is significant, but not enormous concerns – Memory churn was issue, but Geant4 no longer dominates churn
- Seen potential of static builds vs DLLs (difficult for ATLAS)
- Reasonably advanced prototype of MT app for Cori
5
6
7
8
IF Summary
- A variety of programs – hard to generalize CPU/memory uses
- Still use relatively old versions of Geant4 (9.2, 9.4, 9.6)
- Generally, open to new technology (MT, track parallelism,
multi- cores, etc) if no extra efforts are necessary
- Effort underway to centralize MC production needs and
estimate required resources
- G4CPT will seek for representative applications to evaluate
computing performance of IF-experiments (profiling and benchmarking)
9
10
11
12
TAU
- Low overhead
- Comprehensive
- Hardware counters and
derivative metrics
- Inclusive vs. exclusive
- Variety of meta-tools for
sophisticated analysis
- …
13
Ex: TAU for Geant4
- Interactive canvas
– Application – Trial – Metric (PAPI HWC) – Thread (multi/many)
- DB-based analysis
- Working in progress
– Add more analysis – Add display options
14
Memory Leakage Monitoring
- S. Y. Jun (Fermilab), G. Cosmo (CERN), A. Dotti (SLAC)
20th Geant4 Collaboration Meeting at Fermilab
- Sept. 28 - Oct. 2, 2015
Memory leak
- Leaks from Geant4? - relatively clean. Two distinct types:
– Memory allocated at initialization, but not explicitly released at the end of program (the majority of the cases, less critical) – Memory allocated within the event loop, but not freed (the most critical and relevant for production runs in the experiments)
- Problem Statement:
– Indication of a poor design for ownership or lifetime of objects – Reduce existing memory leaks – Monitor newly introduced leaks
- Tools
– Igprof (a low-overhead memory profiler - memory footprints) – Valgrind (a great tool for memcheck, but too slow - complete) – Coverity (a static code analysis) – a custom monitoring tool (under developing - efficient)
16
Valgrind Tests: (ex: Geant4 10.2.beta)
- Output: /afs/cern.ch/sw/geant4/dev/QA_tools/Valgrind/logs/
- Definitely Lost: no pointer to the block can be found (i.e, lost
the pointer at the earlier point) – 19 test for major releases
- Geant4 code being released is relatively clean
17
~1M bytes
Summary of Coverity Analysis
- Static analysis: http://coverity.cern.ch/ (289 issues under G4)
- Two types of resource leaks (39) under the Geant4 project
– new on a data-member and does not free it – a new of an object in a method and no clear ownership
- Use std::unique_ptr and move – make ownership explicitly
18
class ¡G4Something; ¡ class ¡G4Class ¡{ ¡ ¡ ¡G4Something* ¡pointer; ¡ ¡~G4Class() ¡{ ¡/*?? ¡should ¡I ¡delete ¡pointer??*/ ¡} ¡ ¡void ¡set( ¡G4Something* ¡p) ¡{ ¡pointer ¡= ¡p;} ¡ ¡ ¡G4Something* ¡get() ¡const ¡{ ¡return ¡pointer; ¡} ¡ }; ¡ //Usage ¡ ¡ ¡G4Something* ¡smt ¡= ¡new ¡G4Something; ¡ ¡ ¡G4Class* ¡cls ¡= ¡new ¡G4Class(); ¡ ¡ ¡cls-‑>set( ¡smt ¡); ¡ //Who ¡owns ¡smt? ¡Who ¡should ¡delete ¡it? ¡
A Custom Memory Leak Monitor
- Check unreleased memory at the exit of an application
– A very light leak monitoring tool (efficient) and complimentary to Valgrind (correctness)
- Push/pop memory alloc/dealloc during an application is
running and dump undeleted pointers at the end program
– Override new and delete (new[] and delete[]) with custom
- perators by adding/removing the address of the caller
– builtin_return_address(0) : return address of the current function – addr2line(pointer) : convert the address of pointer to the file name and line number
19
void* ¡operator ¡new(size_t ¡size, ¡const ¡std::nothrow_t&) ¡_NOEXCEPT ¡ { ¡ ¡ ¡ ¡ ¡return ¡new(size, ¡(char*)__builtin_return_address(0),0); ¡ } ¡
A Custom Monitoring Tool (exampleB2b)
20
- Summary
- List of file names and line numbers for undeleted objects
- Run the memory leak monitor for each reference release
– Select representative examples/tests – Post the list of potential leak (file names and line numbers) – Report a summary (and changes by the release version)
Thank You to All Contributors
21