SLIDE 13 Loan Profitability
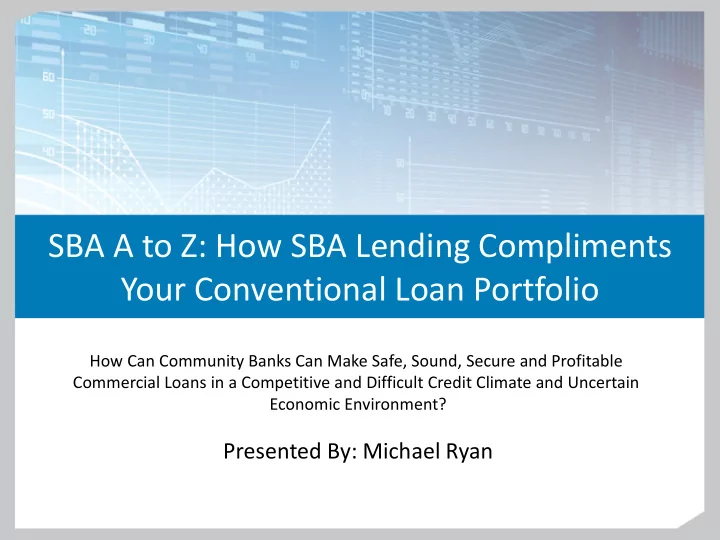
SBA 7(a) vs. Conventional - 5 Yr. - Income Comparison
$- $50,000 $100,000 $150,000 $200,000 $250,000 $300,000 $350,000 $400,000 YR 1 YR 2 YR 3 YR 4 YR 5 Conventional Loan $69,5 $58,4 $57,2 $56,0 $54,7 SBA 7(a) Loans $389, $87,6 $85,8 $84,0 $82,0
Annual Income
Conventional Loan SBA 7(a) Loans
1 2 3 4 5
Conventional Loan: 1x $1 Million @ 6% SBA 7(a) Loans: 4x sold $1 Million SBA 7(a) 75% Guaranteed Loans @ 6% with 110 Premium and 1% Servicing Income on Sold Loans
Premium & Service Fee Income Service Fee Income
- 4x Loan Volume
- Year 1 = Premium Income
- Annual = Servicing Fee
Income
Conventional Loan
*Upon loan sale, the Lender’s exposure decreases to 25%. Four sold $1MM SBA Loans = $1MM total exposure.
Page 13