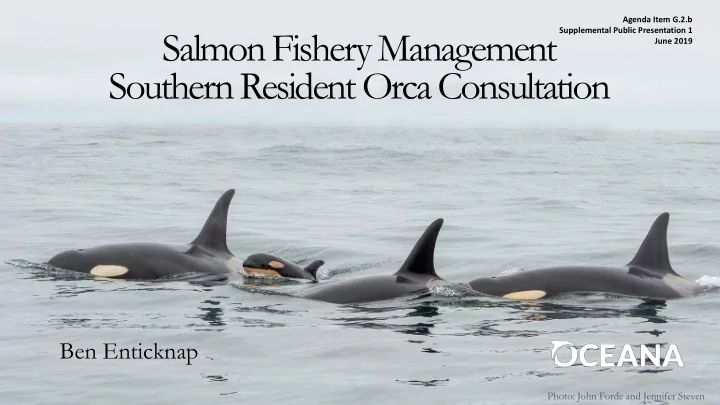

Agenda Item G.2.b Salmon Fishery Management Supplemental Public Presentation 1 June 2019 Southern Resident Orca Consultation Ben Enticknap Photo: John Forde and Jennifer Steven
Southern Resident Killer Whale Population (J,K,L pods) Fecundity rates have • 100 declined: 69% of detectable ESA-listing 95 pregnancies unsuccessful, linked to nutritional stress (Wasser et # Southern Resident Orcas 90 al. 2017) 85 Good news : Two orca births in • 80 2019 (L & J pods); first 76 successful births since 2016 75 Estimated extinction risk of 70 • 49% in 100 years under status 65 quo, and an expected minimum abundance of 15 individuals 60 1990 1992 1994 1996 1998 2000 2002 2004 2006 2008 2010 2012 2014 2016 2018 during a 100-year period (Valez-Espino 2014) Adapted from Center For Whale Research
Threats Last summer, 3-year old Scarlet, or J50, was so emaciated that she lost the fat at the base of her head - what scientists call "peanut head.” Declared dead September 13, 2018. Photo: Katy Foster/NOAA Fisheries Permit No. 18786-03
Ecology: Foraging Selectivity Chinook salmon 1% 4% 15% coho salmon DIET COMPOSITION other salmonids including steelhead 80% other fish including flatfish, halibut, and herring
Seasonal Diet Composition 2% 2% Chinook LATE SUMMER Coho DIET COMP 52% 44% Steelhead Halibut Photo: NOAA Ford MJ, et al. (2016) Estimation of a Killer Whale ( Orcinus orca ) Population’s Diet Using Sequencing Analysis of DNA from Feces. PLoS ONE 11(1): e0144956. doi:10.1371/journal.pone.0144956
Ecology: Range Photo: Miles Ritter / Creative Commons Source: NMFS 2008, SRKW Recovery Plan
Estimated Southern Resident orca spatial distribution for April 2007-2011 using simulated movement tracks, acoustics detections and confirmed sighting reports. Hanson, M.B., E.J. Ward, C.K. Emmons, and M.M. Holt. 2018. Modeling the occurrence of endangered killer whales near a U.S. Navy Training Range in Washington State using satellite‐tag locations to improve acoustic detection data. Prepared for: U.S. Navy, U.S. Pacific Fleet, Pearl Harbor, HI. Prepared by: National Oceanic and Atmospheric Administration, Northwest Fisheries Science Center under MIPR N00070‐17‐MP‐4C419. 8 January 2018. 33 p.
Estimated density for K25 and L84 movement tracks. Heat map is scaled to a uniform distribution of habitat use. Dark red values indicate 35x higher than expected by chance. Photo: Holly Fearnbach, NOAA Hanson et al. 2018.
Daniel Bianchetta / Monterey Bay Whale Watc Orca Need More Salmon Now Photo: USFWS
“Relative importance of chinook salmon abundance on resident killer whale population growth and viability” Population Viability Analysis scenario: A 51% reduction of ocean harvests rates on 5 large Chinook stocks: West Coast Vancouver Is., Columbia Upriver Bright, Fraser Late, Orgon Coastal and Puget Sound. Result : “Mean stochastic population growth indicated a 1.80% annual increase with a mean expected population size of 166 [SRKW] in 35 years” (Vélez-Espino et al. 2014)
12 of 16 priority Chinook stocks below the median THOUSANDS OF FISH 1992-2016 Post Season Q1 Q2 Q3 0-25% 25-75% 75-100% Percent increase/ Lower Upper decrease from Priority Chinook Stock Quartile Median Quartile 2019 Preseason median Northern Puget Sound Fall 63.7 69.3 78.7 67.6 -2% Southern Puget Sound Fall 98.6 142.2 162.6 175.5 23% Lower Columbia Fall 96.1 139.4 234.9 116.6 -16% Strait of Georgia Fall 131.3 172 234.5 167 -3% Lower Columbia Spring 6.8 10.7 19.6 4.2 -61% Upper Columbia/ Snake & Middle Columbia Fall 193.8 309.1 409.6 223.1 -28% Northern Puget Sound Spring 4.9 6.8 8.6 13.4 97% Washington Coast Fall 67.2 84.6 94.7 70.6 -17% Fraser Spring & Fraser Summer 121.8 160.1 202.3 138.3 -14% Middle & Upper Columbia Summer 17.7 55.5 77.6 35.9 -35% Upper Willamette Spring 47 59.5 82 40.2 -32% Southern Puget Sound Spring 1.3 2 3 4.3 115% North & Central Oregon Coast Fall 117.3 162.2 181.7 139.3 -14% West Coast Vancouver Island Fall 99.3 157.9 195.1 195.1 24% Sacramento Fall 131 319.9 460.6 190 -41% Klamath 65.2 90.9 165 98 8% Grand Total (not a sum of above quartiles) 1625.9 1843.5 2576.5 1679.1 -9%
Recommendations for analysis… • Recent and below average priority Chinook runs should be a concern • Shifted baseline: identify the correct “baseline”; one that reflects healthy and abundant Chinook salmon runs that provide for Southern Resident orca population growth. • Include all priority Chinook stocks in the analysis even if not a major component of the fishery.
Cumulative effects: consider all sources of ocean fishing mortality, e.g… 2017- 8,215 Chinook of U.S. West Coast origin caught in the Gulf of Alaska pollock fishery 38% Chinook origin https://www.afsc.noaa.gov/Publications/AFSC-TM/NOAA-TM-AFSC-390.pdf
Recommendations for conservation and management… • Identify and implement a critical Chinook abundance threshold – similar in concept to the ‘cutoff’ factor for forage fish in CPS FMP. • Consider time and area closures to avoid competition with Southern Resident orca • Amend salmon FMP with an objective of managing and regulating salmon fisheries in a manner that accounts for the foraging needs of Southern Resident orca.
Photo: Rachel Merrett
Recommend
More recommend