Research and Adaptive Management Integral to all components - - PDF document

research and adaptive management
SMART_READER_LITE
LIVE PREVIEW

Research and Adaptive Management Integral to all components - - PDF document

Riparian Restoration on California's Coast November 3, 2005 Research and Adaptive Management Integral to all components Recognition of uncertainty Research approaches in stream Commitment to monitor and learn corridor assessment and


slide-1
SLIDE 1

1

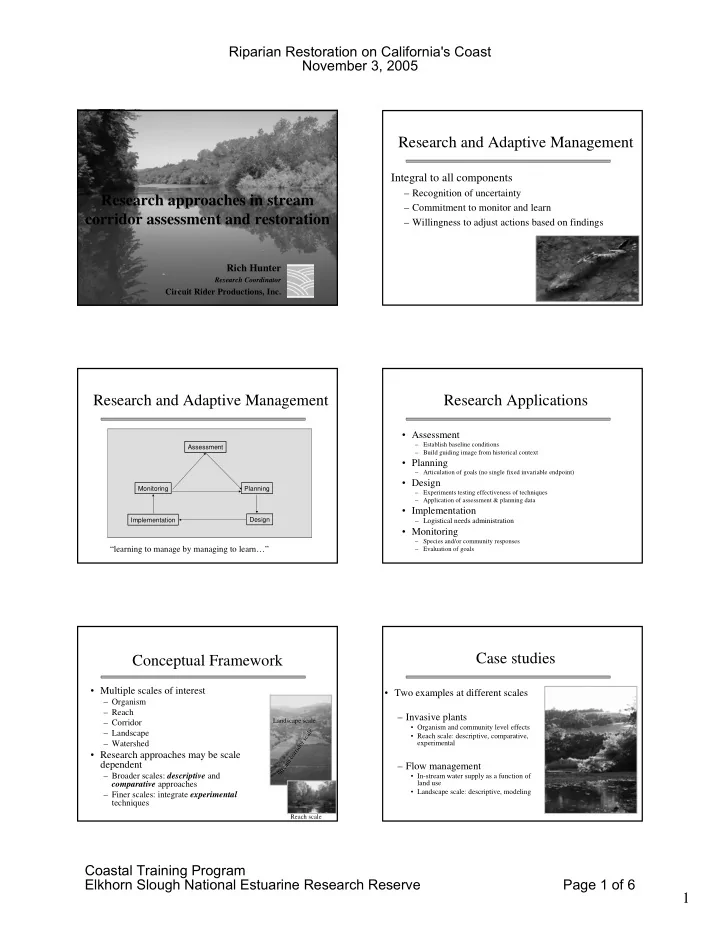
Research approaches in stream corridor assessment and restoration

Rich Hunter

Research Coordinator

Circuit Rider Productions, Inc.

Research and Adaptive Management

Integral to all components

– Recognition of uncertainty – Commitment to monitor and learn – Willingness to adjust actions based on findings

Research and Adaptive Management

Assessment Planning Monitoring Design Implementation

“learning to manage by managing to learn…”

Research Applications

  • Assessment

– Establish baseline conditions – Build guiding image from historical context

  • Planning

– Articulation of goals (no single fixed invariable endpoint)

  • Design

– Experiments testing effectiveness of techniques – Application of assessment & planning data

  • Implementation

– Logistical needs administration

  • Monitoring

– Species and/or community responses – Evaluation of goals

Conceptual Framework

  • Multiple scales of interest

– Organism – Reach – Corridor – Landscape – Watershed

  • Research approaches may be scale

dependent

– Broader scales: descriptive and comparative approaches – Finer scales: integrate experimental techniques

Stream corridor scale Landscape scale Reach scale

Case studies

  • Two examples at different scales

– Invasive plants

  • Organism and community level effects
  • Reach scale: descriptive, comparative,

experimental

– Flow management

  • In-stream water supply as a function of

land use

  • Landscape scale: descriptive, modeling

Riparian Restoration on California's Coast November 3, 2005 Coastal Training Program Elkhorn Slough National Estuarine Research Reserve Page 1 of 6

slide-2
SLIDE 2

2

Taking aim at Arundo

Riparian Ecosystems: Vulnerable to Invasion

  • frequent disturbance
  • open space for

colonization

  • available nutrients
  • available moisture

Plant Invaders & Riparian Systems

  • changes in plant community

composition and structure

  • modification of aquatic plant and

insect assemblages

  • changes in stream temperature and

dissolved oxygen levels

  • influence on carbon availability
  • Native to Asia
  • Clonal: no viable seed
  • Native herbivore = elephant
  • Fire adapted
  • Water use
  • Highly invasive
  • Effects on biotic communities
  • Limited research
  • Large economic costs

Giant Reed (Arundo donax)

  • Assessment & Planning

– What are the effects of Arundo and Vinca on plant communities?

  • Native / exotic seedling abundance

– What is the distribution of Arundo along the riparian corridor ?

  • Design & Implementation

– What are the most effective control methods for Arundo?

  • Monitoring

– Does seedling recruitment differ between treatments?

Selected Arundo Research Questions

Giant Reed in the Russian River Watershed: infestation extent & type

Main Stem – Alexander Valley Arundo infestation from the air

Riparian Restoration on California's Coast November 3, 2005 Coastal Training Program Elkhorn Slough National Estuarine Research Reserve Page 2 of 6

slide-3
SLIDE 3

3

number of seedlings

species type

natives exotics

10 20 30 40

Arundo & Vinca Arundo Only Vinca Only Neither

Number of Seedlings in Arundo and Vinca Invaded Habitats

Removal Techniques

  • Equipment removal
  • Herbicide: cut and paint
  • Hand removal
  • Tarping
  • Trade-offs: cost-effectiveness,

environmental impact

Experiment: Arundo Control Methods and Plant Community Effects

  • Response variables

– Arundo biomass – Plant Abundance: seedling -- native/exotic

  • Treatments

– Control – Repeated cutting and herbicide – Tarping – Repeated cutting

  • Replication

– 24 2 x 2 m plots – 6 blocks – 4 replicates

Assessing Effects Over Time

  • Vegetation sampling:

– prior to Arundo manipulation (Fall 1998) – 2 years after first manipulations (Summer 2000)

  • tarp removed after one year (Fall 1999)
  • cutting and herbicide continued through summer

2000

  • Response variable:

proportion change [ln(2000/1998)] Relative change [ln(2000/1998)]

Arundo biomass Arundo stem number a b c ab bc a a ab

treatment

control cut only herbicide tarp

  • 10
  • 7.5
  • 5
  • 2.5

2.5

  • 5
  • 2.5

2.5

Post-treatment seedling abundance

native exotic

species type

a a b b

Control Cut Only Cut & Herbicide Tarp

  • 1

1 2 3 4

Relative change [ln(2000/1998)]

Riparian Restoration on California's Coast November 3, 2005 Coastal Training Program Elkhorn Slough National Estuarine Research Reserve Page 3 of 6

slide-4
SLIDE 4

4

Conclusions & Next Steps

Research Review

  • Descriptive mapping

– Arundo is widespread throughout watershed and distributed in clumps

  • Observational comparative study

– Seedling abundance in invaded habitats is low

  • Experimental manipulation

– Tarping may be more effective than cut & herbicide – No recruitment differences detected

Planned research

– Energy use / environmental impact in different restoration designs – More non-toxic effective control techniques – Stem node viability and composting – Active vs. passive revegetation

Modeling Landscape Factors to Improve Flow Management Assessment of Landscape-scale Factors

  • What factors outside the riparian

zone are influencing aquatic and riparian habitat?

– Land use – Water use

  • Landscape scale

– Descriptive research – “Secondary” research / modeling

  • Applications

– Improve understanding of broader scaled processes – i.e. River flow management

Dramatic changes in California

Russian River Healdsburg, CA

Project Setting: Russian River Watershed

  • 3885 square kilometer basin
  • Sonoma and Mendocino counties
  • 95% of the Russian River watershed is

in private ownership

  • 34 fish species:

– steelhead, coho, chinook are federally-listed

  • Streamside landowners increasingly

committed to preserving/restoring habitat

  • Increased interest in collaboration

between agencies, the community and landowners

Russian River Riparian Corridors

Landuse and Landuse Change

  • High level of natural and human

disturbance

  • Dramatic land use changes similar to

many coastal California communities

  • Agricultural conversions

– Orchard > Vineyard

  • Urban growth

Changes in Land Use Between 1942 and 1990 Middle Reach, Russian River, California 500 1000 1500 2000 2500 3000 3500 Total Riparian Orchard Vineyard Urban Gravel mining Acres 1942 1990

1942 Riparian Habitat 1990 Riparian Habitat 2000 Riparian Habitat

Loss of Riparian Habitat Between 1942 and 2000 Middle Reach, Russian River, California 200 400 600 800 1000 1200 1400 1940 1990 2000 Year Acres of Riperian Habitat

Russian River Riparian Corridors Riparian Restoration on California's Coast November 3, 2005 Coastal Training Program Elkhorn Slough National Estuarine Research Reserve Page 4 of 6

slide-5
SLIDE 5

5

Russian River Hydrology

  • 110 mile long mainstem, 2 large dams

– Potter Valley diversion from Eel – Flow regime change, esp. low / summer

  • Flow management issues

– Salmonid recovery planning – Urban/residential supply, growth, flooding – Agriculture – Recreation and tourism

  • Sonoma County Water Agency

– RR conduit -- water delivery to North Bay – SWRCB Decision 1610 -- minimum flow compliance points govern releases from dams – Many depletions occur along long sections between dams and compliance points – Avoid violations by extra releases

Coyote Dam (1958), Lake Mendocino Warm Springs Dam (1975), Lake Sonoma

Water Use Variation and Magnitude

  • Largest unknown depletions associated with

vineyards (90% of basin agriculture)

  • Irrigation: high spatial & temporal variability

– Soil moisture capacity – Start date / annual weather differences – Practices: regulated deficit irrigation – Application rates and consistency

  • Current model cannot explicitly account for

this variation

  • How big are potential irrigation diversions

compared to the magnitude of minimum instream flows?

– If large, better data can improve predictive understanding for more precise management

Land and Water Use Modeling

  • GIS map inputs

– Land use (parcels)

  • Where are the vineyards?

– Soil types (NRCS)

  • What are the moisture characteristics?

– CIMIS station data (precip, temp, ET)

  • What are evapotranspiration rates?

– Water rights zones

  • Where are riparian, appropriative rights?
  • Agricultural data

– Crop coefficients

  • How much water can vines use?

– RDI, start dates

  • What are amounts of intentional deficit?

Land and Water Use Modeling

  • Data input to standard computation of potential crop water use
  • Bars indicate total potential ET on monthly basis

– Soil + irrigation = actual ET – Plants are using full potential from Jan – June – Deficit irrigation occurs from July – Oct or Nov.

Model Results

  • Total diversions summed by reach using predicted irrigation amounts
  • How big are irrigation diversions relative to minimum instream flows?

– Minimum instream flows range from 25 – 125 cfs – Irrigation diversions are potentially >100% of minimum instream flows during dry conditions – Highly uncertain in June and July – Start date accounts for much

  • f this variability

Model Application

  • Predictability of irrigation start dates

– June/July variability can be reduced if start dates are known – Each reach has unique soil characteristics and microclimates

  • Late season precipitation

explains 69-80% of the variation in start date

  • Simple regression

equations can assist flow management team predict start dates by reach

Riparian Restoration on California's Coast November 3, 2005 Coastal Training Program Elkhorn Slough National Estuarine Research Reserve Page 5 of 6

slide-6
SLIDE 6

6

Model Application

  • How does potential irrigation compare with permitted

amounts?

– Caution! model limits… – For each water right with permitted diversion rate, demands were calculated for July (peak irrigation) – Permitted diversions < 150 gpm, potential rate frequently exceeds permitted rate – Most larger permitted rates are well above potential

  • Cropping changes

Research review

  • Descriptive data were modeled to

simulate monthly irrigation demands

  • Better info could improve flow

management precision because the depletions are large relative to targeted flow requirements

  • Late season precip is key factor
  • Some small permitted water rights may

be overextended but most are not

Future directions

  • Examine finer spatial and temporal

scales

  • Calibrate model predictions with field

plot data

Conclusions and Next Steps Research Approaches

  • Research approaches are scale dependent
  • Type of question should match with appropriate research

technique

– Who, what, where, when, how? – Do groups differ? – Is there a cause-and-effect relationship?

  • Research is integral to adaptive management
  • Learn to manage by managing to learn…

Riparian Restoration on California's Coast November 3, 2005 Coastal Training Program Elkhorn Slough National Estuarine Research Reserve Page 6 of 6