
SLIDE 1
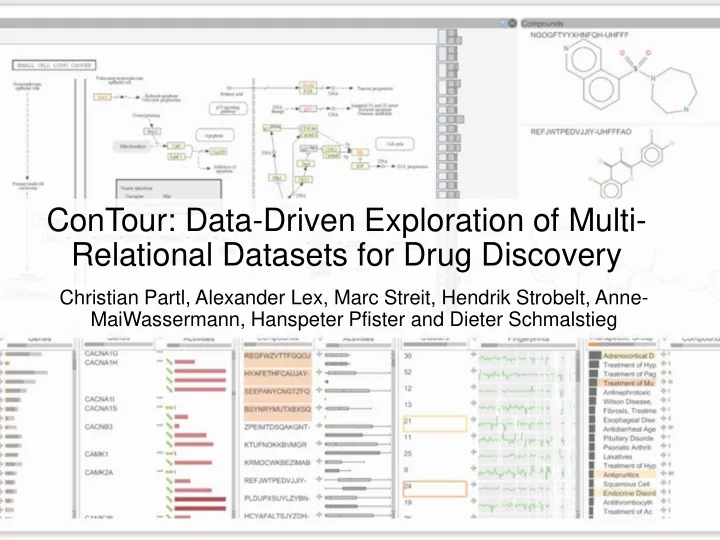
ConTour: Data-Driven Exploration of Multi- Relational Datasets for Drug Discovery
Christian Partl, Alexander Lex, Marc Streit, Hendrik Strobelt, Anne- MaiWassermann, Hanspeter Pfister and Dieter Schmalstieg
Relational Datasets for Drug Discovery Christian Partl, Alexander - - PowerPoint PPT Presentation
ConTour: Data-Driven Exploration of Multi- Relational Datasets for Drug Discovery Christian Partl, Alexander Lex, Marc Streit, Hendrik Strobelt, Anne- MaiWassermann, Hanspeter Pfister and Dieter Schmalstieg Domain Problem = biological receptor
ConTour: Data-Driven Exploration of Multi- Relational Datasets for Drug Discovery
Christian Partl, Alexander Lex, Marc Streit, Hendrik Strobelt, Anne- MaiWassermann, Hanspeter Pfister and Dieter Schmalstieg
= biological receptor = biological target = chemical compound = potential target = direct target = inhibits target
Result (Phenotype) Interaction Compound
UNDERSTANDING DRUG DISCOVERY
Scenario 1: Targeted interaction, understood mechanism, desired outcome
Domain Problem
= biological receptor = biological target = chemical compound = potential target = direct target = inhibits target
Result (Phenotype) Interaction Compound Scenario 2: Indirect interaction, understood mechanism, desired outcome
UNDERSTANDING DRUG DISCOVERY
Domain Problem
= biological receptor = biological target = chemical compound = potential target = direct target = inhibits target
Result (Phenotype) Interaction Compound Scenario 3: Complex interactions, mechanism poorly understood, multiple outcomes
UNDERSTANDING DRUG DISCOVERY
Domain Problem
modulates
indications
Domain Problem
History View Filter View Relationship View Pathway View Compound View
Data Abstraction
derived* derived
* Derived using a scheme propose by the Prous Integrity database
Data Abstraction
“The drug discovery domain problem can be generalized to the problem
that our approach is applicable to many other problems.”
Data Abstraction
“The multi-relational data exploration problem can be interpreted as a graph exploration problem where each item of each dataset represents a node and the relationships between the items are the edges”
Item selection and highlighting
Task Analysis
Clicking, not hovering, on an item also moves all related items in columns to the top
Selection-based filters
Task Analysis
Filter choices when multiple items are selected
Nesting
Task Analysis
Simple Nesting
Nesting
Task Analysis
Recursive Nesting
Relationships with a Set of Items
Nesting
Task Analysis
Simple Nesting Recursive Nesting
Task Analysis
Enrichment Score Judging how specific two items are when compared to a third
Where: I = clusters K = compounds J = Pathways S(i,j) = pair score
compounds clusters pathways
*I assume they take care of divide by 0?
Task Analysis
Enrichment Score Sort by enrichment score
compounds clusters pathways
Sorting by interest Sort alpha-numerically
Task Analysis
Enrichment Score Sort by enrichment score
compounds clusters pathways
Sorting by interest Sort alpha-numerically
Task Analysis
Depends on tasks 1 and 2 Navigation Local Filter : filter within a specific column Global Filter: remove items that are not connected to the source column
Task Analysis
Depends on tasks 1 and 2 Simple Nesting Recursive Nesting Selection-based filters Nesting Navigation
Pathway View
Task Analysis
Compound Clusters Individual Compounds
Marks
Task Analysis
Total # of compounds that interact with pathway Total # of compounds that interact with pathway
Pathway View
Channels Size Saturation Hue Compounds binding None Many One
Task Analysis
Pathway View
Linked Views Highlighting Hover
Task Analysis
Compound View
Hue : Elements
source code: https://github.com/Caleydo/
Algorithm Design
History View Filter View Relationship View Pathway View Compound View
Relationship View
Relationship View
Relationship View
Relationship View
Relationship View
Approximately 100 numerical values shown here
Relationship View
Approximately 100 numerical values shown here
Compound:Gene binding Activating Inhibiting Binding
Relationship View
T1 T2 T3 T4
T5 T5
System ConTour
What : Data
Multi-relational databases; node-link graph; clusters (derived)
Why : Tasks
Discovery; drill down; highlight relationships
How: Ranking & sorting How: Filtering How: Selection & Highlighting Scale:
Dozens of columns; upper limit on HD display appears to about 20. Thousands of data items. Up to 8 simultaneous views for compounds; only 1 for pathways Linked highlighting across facets; automatic sorting Drag and drop (nesting); user control (navigation)
How: Encode How: Facet
Side-by-side linked views, containing tabular data, bar plots, glyphs Simple marks with manipulation of hue and saturation (pathway view) Enrichment score; highlight; user control (navigation)
How: Multiple Views
Relationship view; pathway view; compound view; history and filters
structured datasets
it would be good to highlight this with some uncertainty