public policies social networks and epidemic processes
play

publicpolicies,socialnetworksandepidemicprocesses Social networks - PowerPoint PPT Presentation

Studyingtherelationshipbetweenindividualbehavior, publicpolicies,socialnetworksandepidemicprocesses Social networks Policies & Disease individual Dynamics behaviors MadhavMarathe


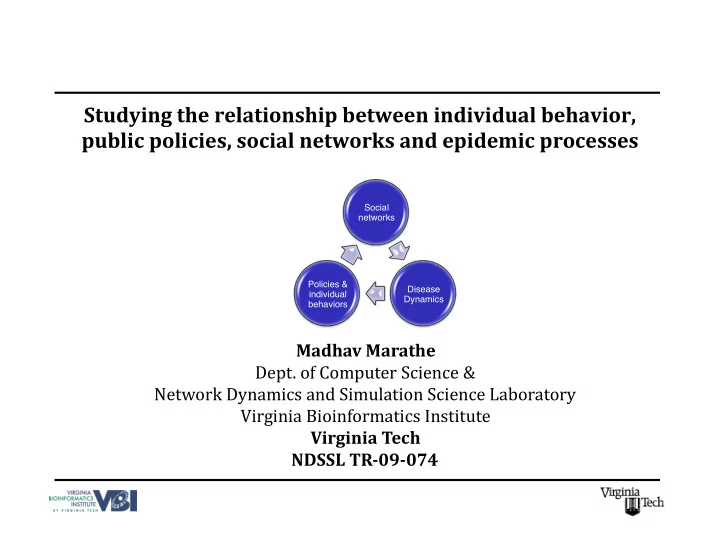
  1. Studying
the
relationship
between
individual
behavior,
 public
policies,
social
networks
and
epidemic
processes
 
 Social networks Policies & Disease individual Dynamics behaviors Madhav
Marathe
 Dept.
of
Computer
Science
&

 Network
Dynamics
and
Simulation
Science
Laboratory
 Virginia
Bioinformatics
Institute
 Virginia
Tech
 NDSSL
TR­09­074 


  2. Work
funded
in
part
by
NIGMS,
MIDAS

program,

CDC
Center
of
Excellence
 in
Medical
Informatics,
DTRA
,
NSF
HSD,
NECO,
NETS
and
OCI
programs 


  3. Models
in
Mathematical/Computational
 Epidemiology 
 Mathematical Models for Epidemiology Differential Equation Based Network-Based Modeling [Hethcote: SIAM Review] [Newman SIAM Review] Simple Random networks Realistic Social Networks ODE’s Stochastic ODE’s [Barabasi, Moore, [Eubank et al. Marathe, [Ross, McDonald, Hamer, [Bartlett, Bailey,, Brauer, Newman, Meyer, Longini et al. Ferguson et Kermack, McKendrick Castillo-Chavez] Vespignani] al.] Network Dynamics and Simulation Science Laboratory

  4. Simdemics:
High
resolution
network­based
modeling
 1. Create
a
synthetic
population
 Sampling
Contingency
Tables,
Assignment
Problems

 • 2. 
Derive
a
social
contact
network
G
 Assign
activities
(CART
Trees),
locations
(Gravity
models),
 • Construction
and
analysis
of
large
networks
 3. 
Create
a
model
of
disease
transmission
 Design
probabilistic
timed
finite
state
automata
based
on
data 
 • 4. 
Simulate
disease
spreads
over
G

 Simulation
of
a
diffusion
process
 • 5. 
Study
effect
of
interventions:
co‐evolution
of
G,
 behavior,
policy
and
disease
progression
 Markov
decision
processes
(MDP)

and
 n ‐way
games
 • Eubank,
Marathe
et
al.
Nature’04,
SODA,
Scientific
American,
DIMACS,
Longini
et
al.
PNAS
06,
Science
05,
 Ferguson
et
al.
Nature
05,
06.


  5. Step
1:
Synthetic
populations
  Who,
where,
what,
 when :
 People 
 – Individuals

 – Household
structure
 – Statistically
identical
 to
U.S.
Census
 – Assigned
to
Home
and 
 Activity
Locations
 Beckman et al. Transportation Science, NISS technical reports, Barrett et al. TRANSIMS technical reports

  6. Step
2:
Urban
dynamic
social
contact

network 
  Demographically
match
schedules
  Assign
appropriate
locations
by
 activity
and
distance
  Determine
duration
of
interaction
  Generate
social
network


  7. Social
Contact
Networks
are
not
easy
to
shatter 
 
 Vaccinating (quarantining) high-degree people Closing down high-degree locations Network Dynamics and Simulation Science Laboratory

  8. Realistic
Social
Contact
network
differ
from
 “simple”
random
networks 
 Epicurves 80000 Clique
 Orig 25% shuffled 70000 50% shuffled 60000 75% shuffled 100% shuffled #infections 50000 40000 30000 20000 10000 0 0 20 40 60 80 100 120 140 160 180 Day Portland
Network:

  Cliques
within
same
age
group
(0‐19).

  
Simple
random
graph
models
cannot
produce
these
structures


  9. Step
3.
Within
Host
Disease
Models
 Disease
can
be
spread
from
one
 person
to
another.
 The
probability
of
transmission
 can
depend
on:
 ‐
type
of
disease
 ‐
duration
and
type
of
contact
 ‐
person’s
characteristics


‐
age,
health
state,
etc.
 Within
host
model:
 Probabilistic
timed
 transition
systems
(PTTS)


  10. Step
4:
Fast
Simulations
for
Disease
Spread
 EpiFast
 Distinguishing
 EpiSims
 EpiSimdemics
 Features
 (Nature’04)
 (SC’09)
 (ICS’
2009)

 Discrete
Event
 Interaction‐Based
 Combinatorial Solution
Method
 Simulation
 Simulation
 +discrete
time
 Performance
180
 days
9M
hosts
&
 ~40
hours
 2
hours
 Few
minutes
 40
proc.

 Co­evolving
Social
 Works
 only 
with
 Can
work
 Works
Well
 Network
 restricted
form
 Edge
as
well
as
 Disease
 Edge
as
well
 Edge
based,
 vertex
based
(e.g.
 transmission
 as
vertex
 independence
of
 threshold

 model
 based
 infecting
events
 functions)


  11. Visualizing
the
spatio‐temporal
diffusion 
 Spatial and Temporal details on spread of disease at this scale and fidelity

  12. Step
5:
Study
Effects
of
Interventions 
  Specifying
a
Situation
(Scenario)

 – E.g.
How
to
represent
cascading
failures?

  Kinds
of
Interventions
 – PI:
Vaccines
and
Anti‐viral,
Anti‐biotic
 – NPI:
Social
distancing,
quarantining
  Specifying
an
Intervention

 – When,
where,
whom

&

how
much
  Cost
Functions
 – Human
suffering
averted
 – Time
gained
(delay
of
exponential
growth)
 – Resource
constraints
 Mathematical
Model:
POMDP
&
 n ­way
games

  13. Interventions:
Partially
Observable
Markov
 Decision
Process
(POMDP) 
 Social networks Policies & Disease individual Dynamics behaviors  Behaviors
and
Disease
dynamics
can
be
cast
as
 generalized
reaction
diffusion:
Leads
to
coupled
networks
  Co‐evolving
dynamical
systems


  14. New
Network
Measures
and
an
application
to
 optimal
allocation
of

PI 


  15. Vulnerability
and
Criticality
of
nodes 
  V(i) 
=
Vulnerability
of
a
node
 i
 =
probability
of
 getting
infected,
if
the
disease
starts
at
a
random
 node
  Criticality (v) :
reduction
in

epidemic
size
when
the
 node
is
vaccinated
  V(i,
t) 
=
Vulnerability
of
a
node
 i
 at
time 
t =
 probability
of
getting
infected
during
the
first
 t 
time
 steps
  Depends
on
  Initial
conditions
  Transmission
probability
  Network
structure
‐
not
a
first
order
property
 Blue
nodes
are
highly
critical
but
not
 very
vulnerable

 Network Dynamics and Simulation Science Laboratory Temporal
version:
probability
of


  16. Vaccination
based
on
vulnerability
rank
order 
 Contact
graph
on
Chicago,
~
8
million
people
  Highly
vulnerable
nodes
are
also
most
critical
for
this
network
  Network Dynamics and Simulation Science Laboratory

  17. Computing
vulnerability 
  Monte‐carlo
samples:
each
sample
by
running
EpiFast 
  
V k (i): 
probability
node
i
gets
infected
in
k
iterations
  
 R(∞):
 top
 n 
nodes
in
vulnerability
order,
 V(i) 
  
 R(t) :
top
 n 
nodes
in
temporal
vulnerability
order
 V(i,t) 
 Change in ||V k || |R( ∞ ) - R(t)| Network Dynamics and Simulation Science Laboratory

  18. Correlation
with
static
graph
measures 
 vulnerability vulnerability degree Clustering coefficient centrality Very little information from static graph measures vulnerability Network Dynamics and Simulation Science Laboratory

  19. Correlations
with
labels 
 vulnerability vulnerability age Total contact time of a node  Similar correlations at different transmission probabilities  Need better models for individual activities and contact duration Network Dynamics and Simulation Science Laboratory

  20. An
illustrative
case
study:
allocating
and
 distributing
A/Vs
through
public
and
private
 stockpile 
 (Marathe
et
al.) 


  21. The
problem 
 Price/ Inventory Disease Demand Dynamics/ Prevalence Network Susceptibility Structure

  22. The
Setup
  Use
Simdemics
modeling
framework 
  All
modeling
assumptions
used
in
this
study
are
the
same
as
were
used
 for
the
“MIDAS
medkit”
study

in
June
2008
 – Exception
1:
Market
distribution
replaces
the
pre‐assignment
of
AV
kits
 based
on
income
 – Exception
2:
Self
Isolation
of
households
based
on
prevalence
and
sick
 member
 – Exception
3:
Disease
prevalence
used
as
a
mechanism
for
adaptation
 – Disease
model,
Reporting,
Diagnosis
and
Distribution
Models:
Same 
  New
River
Valley
population
size:
150K
  The
total
stockpile
of
AV
is
15k

(10%
of
the
population
size).
  The
price
of
the
AV
kit
can
vary
between
$50‐$150
(2008
study:
100$).
  Total
household
budget
for
the
AV
is
1%
of
the
income.

  The
private
stockpile
can
be
purchased
by
anyone
who
can
afford
it.


Download Presentation
Download Policy: The content available on the website is offered to you 'AS IS' for your personal information and use only. It cannot be commercialized, licensed, or distributed on other websites without prior consent from the author. To download a presentation, simply click this link. If you encounter any difficulties during the download process, it's possible that the publisher has removed the file from their server.

Recommend


More recommend