
1
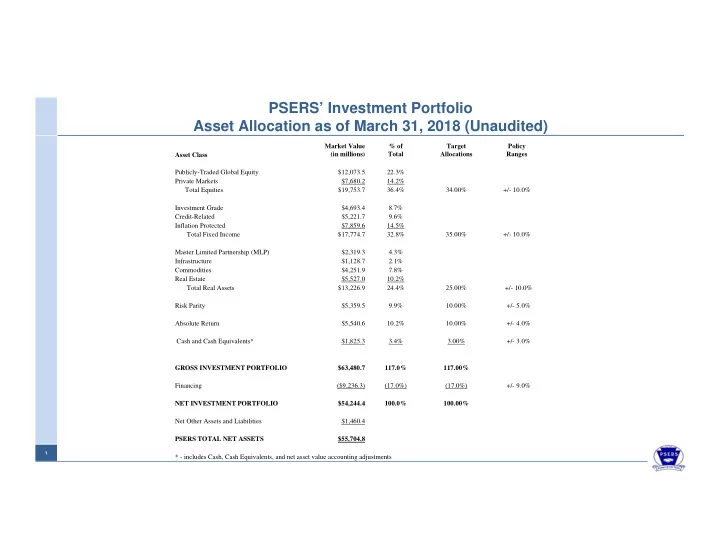
PSERS’ Investment Portfolio Asset Allocation as of March 31, 2018 (Unaudited)
Asset Class Market Value (in millions) % of Total Target Allocations Policy Ranges Publicly-Traded Global Equity $12,073.5 22.3% Private Markets $7,680.2 14.2% Total Equities $19,753.7 36.4% 34.00% +/- 10.0% Investment Grade $4,693.4 8.7% Credit-Related $5,221.7 9.6% Inflation Protected $7,859.6 14.5% Total Fixed Income $17,774.7 32.8% 35.00% +/- 10.0% Master Limited Partnership (MLP) $2,319.3 4.3% Infrastructure $1,128.7 2.1% Commodities $4,251.9 7.8% Real Estate $5,527.0 10.2% Total Real Assets $13,226.9 24.4% 25.00% +/- 10.0% Risk Parity $5,359.5 9.9% 10.00% +/- 5.0% Absolute Return $5,540.6 10.2% 10.00% +/- 4.0% Cash and Cash Equivalents* $1,825.3 3.4% 3.00% +/- 3.0% GROSS INVESTMENT PORTFOLIO $63,480.7 117.0% 117.00% Financing ($9,236.3) (17.0%) (17.0%) +/- 9.0% NET INVESTMENT PORTFOLIO $54,244.4 100.0% 100.00% Net Other Assets and Liabilities $1,460.4 PSERS TOTAL NET ASSETS $55,704.8 * - includes Cash, Cash Equivalents, and net asset value accounting adjustments