
SLIDE 1
ì
Probability and Statistics for Computer Science
“All models are wrong, but some models are useful”--- George Box
Hongye Liu, Teaching Assistant Prof, CS361, UIUC, 11.17.2020 Credit: wikipedia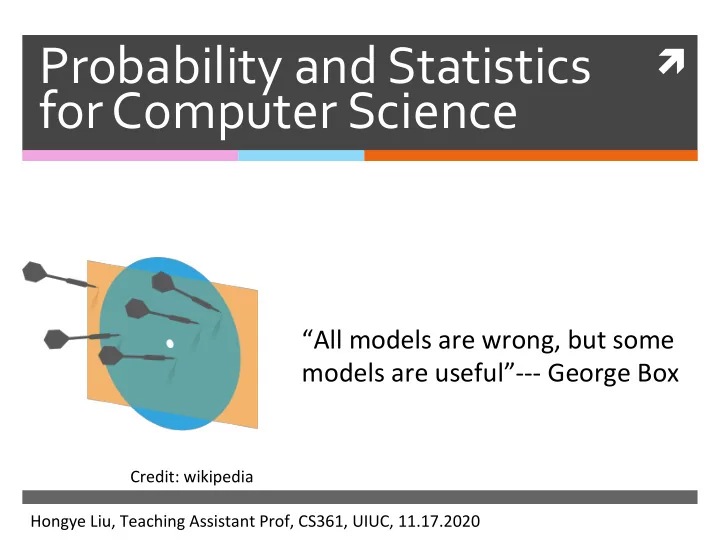
Probability and Statistics for Computer Science All models are - - PowerPoint PPT Presentation
Probability and Statistics for Computer Science All models are wrong, but some models are useful--- George Box Credit: wikipedia Hongye Liu, Teaching Assistant Prof, CS361, UIUC, 11.17.2020 Last time StochasOc Gradient Descent
ì
Probability and Statistics for Computer Science
“All models are wrong, but some models are useful”--- George Box
Hongye Liu, Teaching Assistant Prof, CS361, UIUC, 11.17.2020 Credit: wikipedia Last time
StochasOc Gradient Descent Naïve Bayesian Classifier }
classifier
Some popular topics in Ngram
Objectives
*
Linear regression
detrition
.* The
least square
solution
* Training
andprediction
*
R - squares
for
evaluating else fit
. Regression models are Machine learning methods
Regression models have been around
for a while
book has 3+ chapters on regression
The regression problem
classification
Y
x; " . .yo!
xY¥?
gut
. . . x' d ' Y 0.5 I * Chicago social economic census
The census included 77 communiOes in Chicago The census evaluated the average hardship index of the residents The census evaluated the following parameters for each community: Wait, have we seen the linear regression before?
Correlation
XT
iii.
÷÷÷:
"
It’s about Relationship between data features
Example: Is the height of people related to
their weight?
x : HIGHT, y: WEIGHT
Some terminology
Suppose the dataset consists of N labeleditems
If we represent the dataset as a table The d columns represenOng are calledexplanatory variables
The numerical column y 1 3 2 3 2 3 6 5 yx(1) x(2)
{(x, y)} (xi, yi)x(j)
{x} is called the dependent variable
÷
w/
Variables of the Chicago census
[1] "PERCENT_OF_HOUSING_CROWDED" [2]"PERCENT_HOUSEHOLDS_BELOW_POVERTY" [3] "PERCENT_AGED_16p_UNEMPLOYED" [4]"PERCENT_AGED_25p_WITHOUT_HIGH_SCHOOL_DI PLOMA" [5] "PERCENT_AGED_UNDER_18_OR_OVER_64" [6]"PER_CAPITA_INCOME" [7] "HardshipIndex"
Which is the dependent variable in the census example?
e
Linear model
We begin by modeling y as a linear funcOon ofplus randomness
In vector notaOon: 1 3 2 3 2 3 6 5 yx(1) x(2)
x(j)
y = x(1)β1 + x(2)β2 + ... + x(d)βd + ξWhere is a zero-mean random variable that represents model error
ξ y = xTβ + ξWhere is the d-dimensional vector of coefficients that we train
β
re i
xT=[ x"
x " Each data item gives an equation
1 3 2 3 2 3 6 5 yx(1) x(2)
y = xTβ + ξ = x(1)β1 + x(2)β2 + ξ The model:Training data
y =5=3 xp it Gxpu -193
Which together form a matrix equation
1 3 2 3 2 3 6 5 yx(1) x(2)
y = xTβ + ξ = x(1)β1 + x(2)β2 + ξ The modelTraining data
2 5 = 1 3 2 3 3 6 β1 β2
ξ1 ξ2 ξ3
ECT 1=0
17
'
y
.
If
w'kno
Which together form a matrix equation
1 3 2 3 2 3 6 5 yx(1) x(2)
y = xTβ + ξ = x(1)β1 + x(2)β2 + ξ The modelTraining data
2 5 = 1 3 2 3 3 6 β1 β2
ξ1 ξ2 ξ3
y = X · β + e
Training the model is to choose β
Given a training dataset , we want to fit amodel
Define and and To train the model, we need to choose that makessmall in the matrix equaOon
{(x, y)} y = xTβ + ξ y = y1 . . . yN X = xT 1 . . . xT N e = ξ1 . . . ξN βe
y = X · β + e ① Least Square =②
MLE
loss function Textbook pg 309 Training using least squares
In the least squares method, we aim to minimize DifferenOaOng with respect to and semng to zero If is inverOble, the least squares esOmate ofthe coefficient is:
β e2 e2 = y − Xβ2 = (y − Xβ)T(y − Xβ)XTXβ − XTy = 0
XTXsuit
O -
"×F=xty
①
F= arguing
Hell 'Y
XTX
XT ~ Ix N
X ~
Nxd
+ns.XN.d > ai =XTX
~ dxdA
symmetric
. real waggedfr
XTX ,
we n :3 o have - Derivation of least square solution
Hell21bII=b⇒ym=×Ty#⇒2lMfTpzxTxp
W since bta is scalar 2fpT×Ty , . . . XTX is symmetricHb'=2lbIaa=2'f=b
⇒ zp- = Y . : ×T×= x)T Note yell ' is scalar , all items in c ') are scalar ,,×T×+ ( XTXJTIZXTX 211ell 'Ip
=⇒xTxp=5#
⇒✓
here y is vector Derivation of least square solution
xty-xtx.pt
⇒ xtlyX'
'ndxn ⇒ XTe=o Cdt ' I e - ax , ⇒eTX=o
lied )
# e)Io
^⇒ eTxp=o city
^et XP
uncorrelated
! : ( east square
Loss function
KHell? ftp.s-EQjcps-7?,cxTjp-ygj2
jaj
' Lei
in the finalproject
I
Qjl 01=1540
I Qj= ? 2 = ?
20 Convex set and convex function
If a set is convex,any line connecOng two points in the set is completely included in the set
A convex funcOon:the area above the curve is convex
The least squarefuncOon is convex
Credit: Dr. Kelvin Murphy f(λx + (1 − λ)y) < λf(x) + (1 − λ)f(y)full = o -
VE
. What’s the dimension of matrix XTX?
X n Nx d
XT ~
Ix N
D
Xtx - did
d
→ # of features(explanatory
van . Is this statement true?
If the matrix XTX does NOT have zero valued eigenvalues, it is inverOble.
Rizo
El
it dit -
to - all it s
Training using least squares example
Model: 1 3 2 3 2 3 6 5 yx(1) x(2)
y = xTβ + ξ = x(1)β1 + x(2)β2 + ξ Training data
Prediction
If we train the model coefficients , we can predictfrom
In the model with The predicOon for is The predicOon for isx0
y = x(1)β1 + x(2)β2 + ξ−1
3β
x0 =Tf
= ztf.tl/- fu A linear model with constant offset
The problem with the modelis:
Let’s add a constant offset to the model y = x(1)β1 + x(2)β2 + ξy = β0 + x(1)β1 + x(2)β2 + ξ
β0 when x° y Training and prediction with constant
x(1) x(2)
y y = β0 + x(1)β1 + x(2)β2 + ξ = xTβ + ξ The model Training data: For1 x(1) x(2)
−3 2
1 3
x0 =
−3 2
1 3 = −3
Comparing our example models
1 3 1 2 3 2 3 3 6 5 4x(1) x(2)
y xT β 1 1 1 3 1 2 3 2 2 1 3 6 5 5x(1) x(2)
y xT β y = β0 + x(1)β1 + x(2)β2 + ξ y = x(1)β1 + x(2)β2 + ξ Variance of the linear regression model
The least squares esOmate saOsfies this property The random error is uncorrelated to the least squaresoluOon of linear combinaOon of explanatory variables. var({yi}) = var({xT
iβ}) + var({ξi})
y
e.txt
XT y
= XT x 'pi
Variance of the linear regression model: proof
The least squares esOmate saOsfies this propertyvar({yi}) = var({xT
iβ}) + var({ξi}) Proof:
Y
= X ft e var ( Y ) = var ( X f ) t var Ce )t z CoV l Xp , e )
. :xpt e
CoV lX f , e) = o Variance of the linear regression model: proof
The least squares esOmate saOsfies this propertyvar({yi}) = var({xT
iβ}) + var({ξi}) Proof:
var[y] = (1/N)([X ˆ β − X ˆ β] + [e − e])T([X ˆ β − X ˆ β] + [e − e])
var[y] = (1/N)([X ˆ β−X ˆ β]T[X ˆ β−X ˆ β]+2[e−e]T[X ˆ β−X ˆ β]+[e−e]T[e−e]) Because ; and e = 0 eT1 = 0 var[y] = (1/N)([X ˆ β − X ˆ β]T[X ˆ β − X ˆ β] + [e − e]T[e − e]) eTX β = 0 = var[X β] + var[e] Due to Least square minimized var[y] Evaluating models using R-squared
The least squares esOmate saOsfies this property This property gives us an evaluaOon metric called R-squared
We have with a larger value meaning abeoer fit.
β}) + var({ξi})
R2 = var({xT
iβ}) var({yi})
0 ≤ R2 ≤ 1 Q: What is R-squared if there is only one explanatory variable in the model?
if
X =
NxtRI
> r2r
is corn . Q: What is R-squared if there is only one explanatory variable in the model?
'y'
= ritevarcijf-r~varciittuas.EE)
p~=rZVarE
was 7=1varcij )
✓aright 2 = r Q: What is R-squared if there is only one explanatory variable in the model?
R-squared would be the correlaQon coefficient squared (textbook pgs 43-44)
R-squared examples
r Linear regression model for the Chicago census data
If= = N - d * d * → # of explanatory + intercept Residual is normally distributed?
The Q-Q plot of the residuals is roughly normal
get
aunties
*pie
T e
e
{e ,}
corrie . Xp ) smallf
ryo=xIqteo
EEf7=o
' { i}@ Normal
Prediction for another community
[1] "PERCENT_OF_HOUSING_CROWDED" [2]"PERCENT_HOUSEHOLDS_BELOW_POVERTY " [3] "PERCENT_AGED_16p_UNEMPLOYED" [4]"PERCENT_AGED_25p_WITHOUT_HIGH_SC HOOL_DIPLOMA" [5] "PERCENT_AGED_UNDER_18_OR_OVER_64" [6]"PER_CAPITA_INCOME" 4.7 19.7 12.9 19.5 33.5 Log(28202) Predicted hardship index: 41.46038 Note: maximum of hardship index in the training data is 98, minimum is 1 The clusters of the Chicago communities: clusters and hardship
The clusters of the Chicago communities: per capital income and hardship
PER_CAPITAL_INCOME Hardship index of communiQes The clusters of the Chicago communities: without diploma and hardship
Hardship index of communiQes Assignments
Read Chapter 13 of the textbook Next Ome: More on linear regression
Additional References
✺ Robert V. Hogg, Elliot A. Tanis and Dale L.
Inference”
Kelvin Murphy, “Machine learning, A
ProbabilisOc perspecOve”
See you next time
See You!