Probability and Statistics for Computer Science In sta(s(cs we - - PowerPoint PPT Presentation

probability and statistics
SMART_READER_LITE
LIVE PREVIEW

Probability and Statistics for Computer Science In sta(s(cs we - - PowerPoint PPT Presentation

Probability and Statistics for Computer Science In sta(s(cs we apply probability to draw conclusions from data. ---Prof. J. Orloff Credit: wikipedia Hongye Liu, Teaching Assistant Prof, CS361, UIUC, 10.06.2020 Last time Cumula(ve


slide-1
SLIDE 1

ì

Probability and Statistics for Computer Science

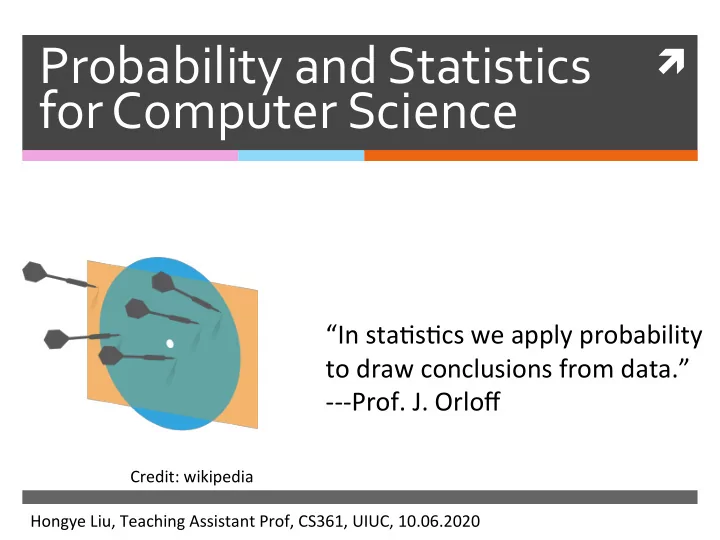
“In sta(s(cs we apply probability to draw conclusions from data.”

  • --Prof. J. Orloff

Hongye Liu, Teaching Assistant Prof, CS361, UIUC, 10.06.2020 Credit: wikipedia

slide-2
SLIDE 2

Last time

✺ Cumula(ve Distribu(on Func(on

  • f a con(nuous RV

✺ Normal (Gaussian) distribu(on

slide-3
SLIDE 3

Objectives

✺ Exponen(al Distribu(on ✺ Sample mean and confidence

interval

slide-4
SLIDE 4

Exponential distribution

✺ Common

Model for wai(ng (me

✺ Associated

with the Poisson distribu(on with the same λ

p(x) = λe−λx for x ≥ 0

Credit: wikipedia

slide-5
SLIDE 5

Exponential distribution

✺ A con(nuous random variable X is exponen(al

if it represent the “(me” un(l next incident in a Poisson distribu(on with intensity λ. Proof See Degroot et al Pg 324.

✺ It’s similar to Geometric distribu1on – the

discrete version of wai(ng in queue

p(x) = λe−λx for x ≥ 0

slide-6
SLIDE 6

Expectations of Exponential distribution

✺ A con(nuous random variable X is exponen(al

if it represent the “(me” un(l next incident in a Poisson distribu(on with intensity λ.

p(x) = λe−λx for x ≥ 0

E[X] = 1 λ & var[X] = 1 λ2

x

slide-7
SLIDE 7

Example of exponential distribution

✺ How long will it take un(l the next call to be

received by a call center? Suppose it’s a random variable T. If the number of incoming call is a Poisson distribu(on with intensity λ = 20 in an hour. What is the expected (me for T?

slide-8
SLIDE 8

Motivation for drawing conclusion from samples

✺ In a study of new-born babies’ health, random

samples from different (me, places and different groups of people will be collected to see how the

  • verall health of the babies is like.
slide-9
SLIDE 9

Motivation of sampling: the poll example

✺ This senate elec(on poll tells us:

✺ The sample has 1211 likely voters ✺ Ms. Hyde-Smith has realized sample mean equal to 51%

✺ What is the es(mate of the percentage of votes

for Hyde-smith?

✺ How confident is that es(mate?

Source: FiveThirtyEight.com

slide-10
SLIDE 10

Population

✺ What is a popula(on?

✺ It’s the en(re possible data set ✺ It has a countable size ✺ The popula(on mean is a number ✺ The popula(on standard devia(on is and

is also a number

✺ The popula(on mean and standard

devia(on are the same as defined previously in chapter 1

Np

{X}

popsd({X})

popmean({X})

slide-11
SLIDE 11

Sample

✺ The sample is a random subset of the

popula(on and is denoted as , where sampling is done with replacement

✺ The sample size is assumed to be much

less than popula(on size

✺ The sample mean of a popula1on is

and is a random variable

X(N)

Np N

{x}

slide-12
SLIDE 12

Sample mean of a population

✺ The sample mean of a popula(on is very similar to

the sample mean of N random variables if the samples are IID samples -randomly & independently drawn with replacement.

✺ Therefore the expected value and the standard

devia(on of the sample mean can be derived similarly as we did in the proof of the weak law of large numbers.

slide-13
SLIDE 13

Sample mean of a population

✺ The sample mean is the average of IID samples ✺ By linearity of the expecta(on and the fact the

sample items are iden(cally drawn from the same popula(on with replacement

X(N) = 1 N (X1 + X2 + ... + XN)

E[X(N)] = 1 N (E[X(1)] + E[X(1)].. + E[X(1)]) = E[X(1)]

slide-14
SLIDE 14

Expected value of one random sample is the population mean

✺ Since each sample is drawn uniformly from the

popula(on

✺ We say that is an unbiased es(mator of the

popula(on mean. therefore

X(N)

E[X(1)] = popmean({X}) E[X(N)] = popmean({X})

slide-15
SLIDE 15

Standard deviation of the sample mean

✺ We can also rewrite another result from the lecture

  • n the weak law of large numbers

✺ The standard devia(on of the sample mean ✺ But we need the popula(on standard devia(on in

  • rder to calculate the !

var[X(N)] = popvar({X}) N

std[X(N)]

std[X(N)] = popsd({X}) √ N

slide-16
SLIDE 16

Unbiased estimate of population standard deviation & Stderr

✺ The unbiased es(mate of is

defined as

✺ So the standard error is an es(mate of

stdunbiased({x}) =

  • 1

N − 1

  • xi∈ sample

(xi − mean({xi}))2

popsd({X})

std[X(N)] = popsd({X}) √ N

std[X(N)]

popsd({X}) √ N . = stdunbiased({x}) √ N = stderr({x})

x

slide-17
SLIDE 17

Standard error: election poll

✺ What is the es(mate of the percentage of votes

for Hyde-smith?

Number of sampled voters who selected Ms. Smith is: 1211(0.51) ≅ 618 Number of sampled voters who didn’t selected Ms. Smith was 1211(0.49) ≅ 593

51% 51%

slide-18
SLIDE 18

Standard error: election poll

✺ ✺

=

  • 1

1211 − 1(618(1 − 0.51)2 + 593(0 − 0.51)2) = 0.5001001

stdunbiased({x})

stderr({x})

= 0.5 √ 1211 ≃ 0.0144

slide-19
SLIDE 19

Interpreting the standard error

✺ Sample mean is a random variable and has its own

probability distribu(on, stderr is an es(mate of the sample mean’s standard devia(on

✺ When N is very large, according to the Central Limit

Theorem, sample mean is approaching a normal distribu(on with

x ;

slide-20
SLIDE 20

Interpreting the standard error

✺ Sample mean is a random variable and has its own

probability distribu(on, stderr is an es(mate of sample mean’s standard devia(on

✺ When N is very large, according to the Central Limit

Theorem, sample mean is approaching a normal distribu(on with

x

µ = popmean({X}) ;

stderr({x}) = stdunbiased({x}) √ N

σ = popsd({X}) √ N . = stderr({x})

slide-21
SLIDE 21

Interpreting the standard error

Credit: wikipedia

99.7% 95% 68% Popula(on mean Probability distribu(on

  • f sample

mean tends normal when N is large

slide-22
SLIDE 22

Confidence intervals

✺ Confidence interval

for a popula(on mean is defined by frac(on

✺ Given a percentage,

find how many units of strerr it covers.

−4 −2 2 4 0.0 0.1 0.2 0.3 0.4 0.5 x dnorm(x)

95% For 95% of the realized sample means, the popula(on mean lies in [sample mean-2 stderr, sample mean+2 stderr]

2

  • 2
slide-23
SLIDE 23

Confidence intervals when N is large

✺ For about 68% of realized sample means ✺ For about 95% of realized sample means ✺ For about 99.7% of realized sample means

mean({x}) − stderr({x}) ≤ popmean({X}) ≤ mean({x}) + stderr({x}) mean({x})−2stderr({x}) ≤ popmean({X}) ≤ mean({x})+2stderr({x}) mean({x})−3stderr({x}) ≤ popmean({X}) ≤ mean({x})+3stderr({x})

slide-24
SLIDE 24
  • Q. Confidence intervals

✺ What is the 68% confidence interval for a

popula(on mean?

  • A. [sample mean-2stderr, sample mean+2stderr]
  • B. [sample mean-stderr, sample mean+stderr]
  • C. [sample mean-std, sample mean+std]
slide-25
SLIDE 25

Standard error: election poll

51%

✺ We es(mate the popula(on mean as 51% with stderr 1.44% ✺ The 95% confidence interval is [51%-2×1.44%, 51%+2×1.44%]= [48.12%, 53.88%]

slide-26
SLIDE 26

Q.

✺ A store staff mixed their fuji and gala

apples and they were individually wrapped, so they are indis(nguishable. if I pick 30 apples and found 21 fuji , what is my 95% confidence interval to es(mate the popmean is 70% for fuji? (hint: strerr > 0.05)

  • A. [0.7-0.17, 0.7+0.17]
  • B. [0.7-0.056, 0.7+0.056]
slide-27
SLIDE 27

What if N is small? When is N large enough?

✺ If samples are taken from normal distributed

popula(on, the following variable is a random variable whose distribu(on is Student’s t- distribu(on with N-1 degree of freedom.

Degree of freedom is N-1 due to this constraint:

  • i

(xi − mean({x})) = 0

T = mean({x}) − popmean({X}) stderr({x})

slide-28
SLIDE 28

t-distribution is a family of distri. with different degrees of freedom

t-distribu(on with N=5 and N=30

William Sealy Gosset 1876-1937 Credit : wikipedia

−10 −5 5 10 0.0 0.1 0.2 0.3 0.4 0.5

pdf of t − distribution

X density degree = 4, N=5 degree = 29, N=30

slide-29
SLIDE 29

When N=30, t-distribution is almost Normal

t-distribu(on looks very similar to normal when N=30. So N=30 is a rule of thumb to decide N is large or not

−10 −5 5 10 0.0 0.1 0.2 0.3 0.4 0.5

pdf of t (n=30) and normal distribution

X density degree = 29, N=30 standard normal

slide-30
SLIDE 30

Confidence intervals when N< 30

✺ If the sample size N< 30, we should use t-

distribu(on with its parameter (the degrees of freedom) set to N-1

slide-31
SLIDE 31

Centered Confidence intervals

✺ Centered Confidence

interval for a popula(on mean by α value, where

−4 −2 2 4 0.0 0.1 0.2 0.3 0.4 0.5 x dnorm(x)

For 1-2α of the realized sample means, the popula(on mean lies in [sample mean-b×stderr, sample mean+b×stderr] α α

P(T ≥ b) = α

slide-32
SLIDE 32

Centered Confidence intervals

✺ Centered Confidence

interval for a popula(on mean by α value, where

−4 −2 2 4 0.0 0.1 0.2 0.3 0.4 0.5 x dnorm(x)

For 1-2α of the realized sample means, the popula(on mean lies in [sample mean-b×stderr, sample mean+b×stderr] α α

P(T ≥ b) = α

slide-33
SLIDE 33

Q.

✺ The 95% confidence interval for a popula(on

mean is equivalent to what 1-2α interval?

  • A. α= 0.05
  • B. α= 0.025
  • C. α= 0.1
slide-34
SLIDE 34

Assignments

✺ Read Chapter 7 of the textbook ✺ Next (me: Bootstrap, Hypothesis tests

slide-35
SLIDE 35

Additional References

✺ Charles M. Grinstead and J. Laurie Snell

"Introduc(on to Probability”

✺ Morris H. Degroot and Mark J. Schervish

"Probability and Sta(s(cs”

slide-36
SLIDE 36

See you next time

See you!