
SLIDE 1
By Joseph Lushombo Matabaro Université Officielle de Bukavu, DRCongo
POPULATIONS OF THE LAKE TANGANYIKA POECILID FISH, LAMPRICHTHYS - - PowerPoint PPT Presentation
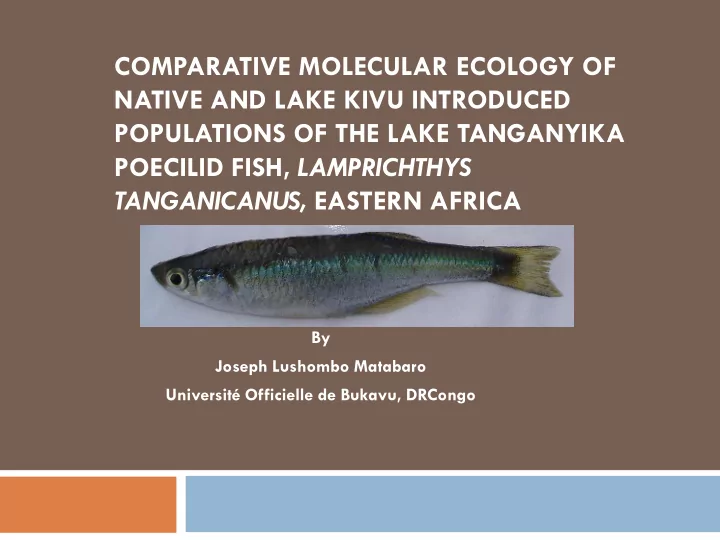
COMPARATIVE MOLECULAR ECOLOGY OF NATIVE AND LAKE KIVU INTRODUCED POPULATIONS OF THE LAKE TANGANYIKA POECILID FISH, LAMPRICHTHYS TANGANICANUS, EASTERN AFRICA By Joseph Lushombo Matabaro Universit Officielle de Bukavu, DRCongo I. INTRODUCTION
By Joseph Lushombo Matabaro Université Officielle de Bukavu, DRCongo
The Albertine rift region is famous for high Biodiversity , livelihoods of riparian and exciting geological events among others. It holds several lakes! Lake Tanganyika, the most ancient of Albertine rift lakes containing several hundreds of endemic fish species (Poll 1986) with fascinating fish ecology making the lake a valuable microcosm for evolutionary studies between species(explosive speciation, adaptive radiation, phylogenetics)
The lake provides animal proteins to over 10 Millions of people in the 4 bounding countries being estimated to 45% proteins for riparian closed to the Lake (LTA, 2010).
Despite its importance, Lake Tanganyika is threatened by: Pollution (sedimentation, industrial and urban discharge),
and use of unconventional fishing gears. In its northern part, Lake Tanganyika receives water drained by the Ruzizi River from Lake Kivu from 120km far away without remarkable mixture of fish species from both lakes.
Lake Kivu,
poor in fish species diversity compared to other great lakes
volcanic eruption
methane and other gases physically dissolved in molecular form in the deep waters.
conditions deeply different from those of Lake Tanganyika
19 Cichlids species: 15 Cichlids species belonging to Haplochromis genus are endemic to Lake Kivu
introduced Limnothrissa miodon, Oreochromis macrochir, Tilapia rendalli, and recently Lamprichthys tanganicanus
Lake Kivu fisheries are many based on the exploitation of the introduced Clupeid fish, Limnothrissa miodon with a minimum sustained yield estimated at about 13500 tons a year Since 2006, several individuals of the poeciliid fish species Lamprichthys tanganicanus are caught together with those of Limnothrissa miodon in Lake Kivu.
The presence
Lamprichthys tanganicanus into Lake Kivu may create some scientific concerns on the origin, period of introduction and its ecology in a new habitat known chemically different from Lake Tanganyika.
Lake Tanganyika is separated with Lake Kivu by natural barrier, the Ngomo falls in the upper Ruzizi River that prevents eventual fish community sharing between these lakes.
Fish introduction has been considered as an ecological threat on indigenous species by competition, predation or hybridization and alteration of the ecosystem health (Marck et al. 2000) Limnothrissa miodon: Disappearance of the greatest Lake Kivu Cladoceran, Daphnia curvirostris (Dumont 1986) and significant impact
(Isumbisho, 2006) Decrease in genetic diversity in the introduced population (Hauser, 1996) Nile Perch, Lates niloticus, Most responsible of change in fish species composition in Lake Victoria.
However, for Lamprichthys tanganicanus, as a New case: No presumption can be formulated without carrying out investigations. Captures are important in Lake Kivu Geographic origin of Lake Kivu population founder is unknown. In addition, invasive species are subject to some adaptation behaviors to survive in and colonize the new environment during invasion (Siervers et al. 2012 )
Specifically, this project aims in both Lakes Kivu and Tanganyika:
2.To compare the reproductive strategies of L. Tanganicanus in both native and introduction habitats 3.To compare the diet of the tanganyika killifish in both native and introduction habitats
introduced populations 5.To compare the genetic structure (native and introduced) and define the geographic origin of L. tanganicanus populations
Among the 4 introduced fish species in Lake Kivu, L. tanganicanus is the only one that has not yet previously been reported in any other reservoirs. Its recent invasion of Lake Kivu is a new case. Baseline information missing! Its ecological characteristics and invasive status of invasive have not yet been investigated .
In addition, the connectivity and genetic history of L. tanganicanus populations have not previously been investigated in any Lake.
Lake tanganyika geographic location of strains that invaded Lake Kivu is not elucidated up to now.
II.1. Study on the Reproductive strategies of L. tanganicanus in both Lakes Kivu and Tanganyika.
Field work Fish sampling was conducted seasonally on both Lakes Kivu and Tanganyika using a set
experimental gillnet
1,5m in depth and 30m in large, mesh size ranged from 9mmx9mm, 10mmx10mm and 15mmx15mm in all sampling sites After fishing, catch was be kept into labelled containers with 10%
shows the time and date of sampling, name of the locality, sampling depth, substrate and geographic coordinates.
II.1. Study on the reproductive strategies of L. tanganicanus in both lakes Kivu and Tanganyika. Lab work:
On each fish specimen, Sex, Weight (g), Standard Length (mm), Total length (mm) was recorded using a weighing scale and manual caliper. After dissection, Gonads was carefully removed and weighed and development stage determined following Legendre and Ecoutin(1989). Gonado-somatic index (GSI) was calculated using the formula proposed by Lagrer (1971). The correlation between weight and Standard Length was computably generated through the regression coefficient with the help of SATISTIICA software.
Lamprichthys tanganicanus in both Lakes Tanganyika and Kivu
Samples were monthly collected in the same sites. On the field, a set of experimental gillnet of 1,5m in depth and 30m in large with 3 different mesh sizes was used. Collected fishes were introduced into labelled containers with 10% formalin for preservation.
In the laboratory, fish samples were first weighed and measured
Each fish was dissected to remove the gut that was also be
II.2. Comparative study on the diet of the Tanganyika Poeciliid fish Lamprichthys tanganicanus in both Lakes Tanganyika and Kivu
Food items from guts ware taxonomically identified using a microscope and microscope slide equipment described by Contente et al. (2012). Individuals of each food item were identified to possible lowest taxonomic level and
been dissected. Diet data will be treated using methods largely used for expression of diet results following Hyslop, 1980, Lalèyè et al. 2006 and Contente et al.( 2012)
Lake Kivu killifish population.
Field work After fishing, and before transferring the catch into formalin solution, samples of tissues were collected on each specimen. On each specimen, the whole right pectoral fin of the fish was removed and kept into labelled vials containing 96% ethanol for preservation. Cryo Vials containing fin samples were kept into fresh cool box being transferred in the laboratory at kept at room temperature.
Lab work Usual activities for molecular studies will be performed on each fish fin samples, these include:
Lake Kivu killifish population
carried out in a molecular Lab
II.3. Population Genetic study in both Lakes Kivu and Tanganyika: Origin of Lake Kivu killifish populations Data analyses Both mitochondrial DNA and microsatellite data will be analysed using DnaSP version 5 and Arlequin ver.3.5 software to determine: Genetic population structure per site in both lakes, Haplotypes diversity per site, Estimate of the size of population, Origin of Lake Kivu population and other genetic parameters following (Menezes et al. 2012), Haynes (2009) and Verheyen et al.(2003).
II.4. Characterization of phenotypic parameters in native and introduced populations of the Tanganyika killifish Lamprichthys tanganicanus
Lab work
Fish specimen were
from individuals that have undergone sampling
Manual caliper was used for measurements and all count data will be recorded using a binocular stereo microscope. 27 Measurements were recorded on each specimen. We followed Wildecampes and Malumbres (2004) for measuring morphometric characters and Van der Zee and Sonnenberg (2011) for meristic records.
Principal component analyses (PCA) techniques will be used to analyse morphometric and meristic data on the covariance matrix of log transformed measurements and the correlation matrix of raw meristcs. II.4. Characterization
phenotypic parameters in native and introduced populations of the Tanganyika killifish Lamprichthys tanganicanus Data analyses
Populations will be ranged in geographical groups to evaluate eventual geographic variations. Differences in ratios of measurements (relative to head or standard length) and meristics for these will be tested using pair wise Mann Whitney U tests.
Variation de la capture de L. miodon par filet selon le milieu
0,5 1 1,5 2 2,5 3 3,5 4 filet9mm filet10mm filet15mm Filet Capture (kg) littorale Pelagique
.1 .2 .3 .4 .5 .6 .7 .8 Cell Mean 08h9h 10h11h 11h12h 12h13h 13h14h 14h15h 15h16h 16h17h 17h18h 17h18h 18h19h 20h21h 21h22h 4h6h 4h6h 5h7h 7h09h 7h8h 8h10h 8h9h 9h10h Cell Interaction Bar Plot for Ltfilet10mm(kg) Effect: heure peche Error Bars: ± 1 Standard Error(s)
.05 .1 .15 .2 .25 .3 .35 Cell Mean 08h9h 10h11h 11h12h 12h13h 13h14h 14h15h 15h16h 16h17h 17h18h 17h18h 18h19h 20h21h 21h22h 4h6h 4h6h 5h7h 7h09h 7h8h 8h10h 8h9h 9h10h Cell Interaction Bar Plot for Ltfilet9mm(kg) Effect: heure peche Error Bars: ± 1 Standard Error(s)
.1 .2 .3 .4 .5 .6 Cell Mean 08h9h 10h11h 11h12h 12h13h 13h14h 14h15h 15h16h 16h17h 17h18h 17h18h 18h19h 20h21h 21h22h 4h6h 4h6h 5h7h 7h09h 7h8h 8h10h 8h9h 9h10h Cell Interaction Bar Plot for Lmfilet10mm(kg) E ffect: heure peche E rror Bars: ± 1 Standard E rror(s)
comparaison de la capture en obscure et lunaire
50 100 150 200 250 300 350 400 Limnothrissa miodon Lamprichthys tanganicanus Haplochromis spp Obscure Lunaire
0.2 0.4 0.6 0.8 Component 1
0.08 0.16 0.24 0.32 Component 2
Male of Kivu: blue spot, n=29 Male of Tang: Red spot, n=24 Female of Kivu: Green spots, n= 19 Females of Tang: Violet spots, n= 21
Morphemetric characteristics of Lt, Unisexual PCA
Males from LK, n=29: filled square Males from LT, n=24: empty square
Morphemetric characteristics of Lt, Unisexual PCA
Females from LK, n=19: filled square Females from LT, n=21: empty square
Comparison of numeric Index in both Lakes
0.00 10.00 20.00 30.00 40.00 50.00 60.00 70.00 80.00 90.00 LT AbI% LK AbI%
Comparison of Occurrence Index in both Lakes
10 20 30 40 50 60 70 80 Oc-I% Kivu, n=120 Oc-I %Tang n=116
Variation of insects feeding within sampling sites and sex
20 40 60 80 100 120 Cell Mean for insect% bralima crh est agrico kalundu kamongola karamba kashekezi kazimia kivovo mbabara pelagique port israel port trafca rafiki ruganda shegeshi M F Cell Bar Chart Grouping Variable(s): site Split By: sexe Error Bars: ± 1 Standard Error(s)
Variation of scales feeding within sampling sites and sex
10 20 30 40 50 60 Cell Mean for Ecailles% bralima crh est agrico kalundu kamongola karamba kashekezi kazimia kivovo mbabara pelagique port israel port trafca rafiki ruganda shegeshi M F Cell Bar Chart Grouping Variable(s): site Split By: sexe E rror Bars: ± 1 Standard E rror(s)
Regression plot Standard Length vs. Body weight, n=120 Regression plot Standard Length vs. Body weight, n=120
Lake Kivu Lake Tanganyika
.4 .5 .6 .7 .8 .9 1 1.1 1.2 1.3 1.4 logPoids 1.75 1.8 1.85 1.9 1.95 2 2.05 LogLS Y = -4.812 + 3 * X; R^2 = .944 Inclusion criteria: Criteria 6 from Lac Kivu.xls (imported).svd
.2 .4 .6 .8 1 1.2 1.4 1.6 logPoids 1.6 1.65 1.7 1.75 1.8 1.85 1.9 1.95 2 2.05 2.1 LogLS Y = -4.996 + 3.099 * X; R^2 = .952
Linear Regression for males (SL vs Body weight Linear Regression for males (SL vs Body weight
Lake Kivu Lake Tanganyika
1.62 1.68 1.74 1.8 1.86 1.92 1.98 2.04 2.1 SL
0.3 0.6 0.9 1.2 1.5 1.8 B.W 1.76 1.8 1.84 1.88 1.92 1.96 2 2.04 SL 0.48 0.6 0.72 0.84 0.96 1.08 1.2 1.32 B.W
Linear Regression for females (SL vs Body weight, n=61 Linear Regression for females (SL vs Body weight, n=37
Lake Kivu Lake Tanganyika
1.75 1.775 1.8 1.825 1.85 1.875 1.9 1.925 1.95 SL 0.32 0.4 0.48 0.56 0.64 0.72 0.8 0.88 0.96 1.04 B.W 1.792 1.808 1.824 1.84 1.856 1.872 1.888 SL 0.52 0.56 0.6 0.64 0.68 0.72 0.76 0.8 0.84 B.W
Lac Stade de maturité Nombre Pourcentage Tanganyika 2 3985 73,9 3 1111 20,6 4 297 5,5 Kivu 2 5998 65,7 3 2150 23,5 4 989 10,8
Frequency of female Gonad maturity stage Evolution of female gonad maturing
10 20 30 40 50 60 70 80 St2 St3 St4 Tanganyika Kivu
Lac moyenne écart-type n min max Tanganyika 145,7 42,6 37 62 242 Kivu 148,9 44,6 61 54 255
K=56.84mm; Tang=61.25mm
Absolute Fecundity Size at first maturity
10 20 30 40 50 60 70 80 90 100 SLMin#3/4 SLMax#3/4 Kivu n=61 Tanganyika, n=37
Variation of GSI within Lakes and Period of sampling
Data analyses for Diet and Reproduction strategies
Mophometric measurements to include samples from
Molecular analyses of samples from many localities