
SLIDE 1
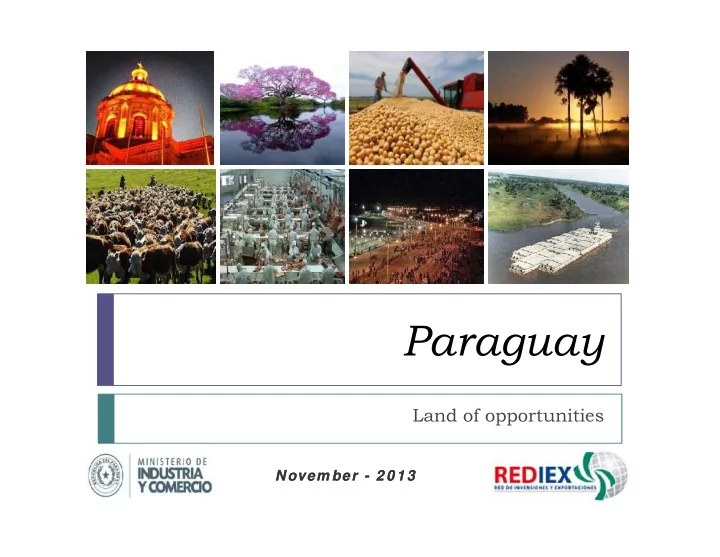
Paraguay
Land of opportunities
Novem ber Novem ber - 2 0 1 3 2 0 1 3
Paraguay Land of opportunities Novem ber Novem ber - 2 0 1 3 2 0 - - PowerPoint PPT Presentation
Paraguay Land of opportunities Novem ber Novem ber - 2 0 1 3 2 0 1 3 General Information General Information Paraguay, in the center of South America Cancer Tropic Equator line Capricorn Tropic Greenwich Meridian +4 +3 +2 +1 0
Land of opportunities
Novem ber Novem ber - 2 0 1 3 2 0 1 3
Cancer Tropic Equator line Greenwich Meridian
+4 +3 +1 +2
Capricorn Tropic
Area (Km.2): 406,752 Official lenguages: Spanish & Guaraní Currency: Guaraní (Since 1943) Exchange rate (US Dollar – Guarani) (2012): 1 USD = 4,070 Gs. Population (2012*): 6,672,631 Nominal Gross Domestic Product GDP** (Bill. USD) –Yr. 2012: 18.2 Nominal Gross Domestic Product GDP Per Capita** (USD) –Yr. 2012: 3,770 Country`s Capital: Asunción Other cities and major economic areas Central Metropolitan Area ASU-CDE-ENC-ASU conexion Central Chaco / NE Zona Ciudad del Este, Encarnación, Salto del Guairá, Coronel Oviedo, Concepción, Santa Rita Working Age Population –WAP (2012): 60.7% of Pop. 3,215,510 Rate of unemployment (2012): 5.7% of the WAP
Sources: Central Bank of Paraguay – BCP (www.bcp.gov.py) *STP/DGEEC. Paraguay: Forecasts 2012 **Yr. Base 1.994
Asunción
Of the total area
Of total area
Western Region or Chaco
Of total population
Of total population
Of total area
Of total population
Total Area (km2) Population 406,752 6,672,631
Source: Dirección Nacional de Estadísticas, Encuestas y Censos (www.dgeec.gov.py) *STP/DGEEC. Paraguay: Forecasts 2012
Eastern Region
Paraguay is located in the center
Brazil Brazil Peru Peru Bolivia Bolivia Ecuador Ecuador Venezuela Venezuela Colombia Colombia
Guyana Guyana French Guyana French Guyana Suriname Suriname
South South America America (100%) (100%)
MERCOSUR MERCOSUR
(70%) (70%) Paraguay + Paraguay + 1.300 km 1.300 km
Chile Chile Argentina Argentina Uruguay Uruguay Bolivia Bolivia
South South America America (100%) (100%)
MERCOSUR MERCOSUR
(70%) (70%) Paraguay + Paraguay + 1.300 km 1.300 km Population (Mill. people)
360 250 120
GDP Billion US$
2.875 1.948 927
GDP per capita (US$)
7.986 7.792 7.725
Source: 2009 Latin American Statistic Yearbook - ECLAC www.eclac.org
capita Income
Paraguay Paraguay
Earthquake risk Tsunami risk Severe weather conditions risk Volcano eruption risk Tectonic plaques Source: US Geological Survey (www.usgs.org)
Paraguay River Pilcomayo River
Average yearly temperature: 28 Cº Average yearly rainfall: 1.200 mm.
Parana River Pilcomayo River
Paraguay is located in the center of the GuaraniAquifer.
Source: Instituto Geográfico Militar – IGM & DGEEC
PERU MÉXICO COSTA RICA PARAGUAY 129 112 111 82
RESIDENTIAL: 200 KWh/mes
CHILE PERU PARAGUAY
135 105 72 57
INDUSTRIALIST: 50 MWh/mes
Fuente: CIER Report about Electric Tariff in Distribution January / 2012 50 100 150 200 250
URUGUAY GUATEMALA EL SALVADOR COLOMBIA BRASIL CHILE PERU 213 205 187 186 163 147 129
50 100 150 200 250 GUATEMALA COSTA RICA EL SALVADOR BRASIL COLOMBIA URUGUAY MÉXICO
213 204 192 183 156 139 135
$/MWh $/MWh
20 30 40 50 60 70 80 73,7 73,4 67,4 65,7 60,1 59,9 54,8
Population younger than 34 years old (%)
Paraguay has the youngest population in
10 20
Sources: Dirección Nacional de Estadísticas, Encuestas y Censos (www.dgeec.gov.py) Worldmapper (www.worldmapper.net)
Rio Paraguay Rio Paraguay
Conchas Conchas Corumbá Corumbá
Santacruz Santacruz Rosario Rosario Nueva Palmira Nueva Palmira Antofagasta Antofagasta Paranagua Paranagua ASU ASU
Rio Paraguay Rio Paraguay
Santos Santos CDE CDE Mejillones Mejillones
Conchas Conchas
Montevideo Montevideo Sao Paulo Sao Paulo Buenos Aires Buenos Aires Santiago Santiago
Main Commercial Centers Paraguayan free ports Important regional ports Barges Transatlantic Ships
Source: Rediex
Waterways Lenght (miles) Conexions Paraguay- Paraná - Uruguay 1,721 Bolivia-Paraguay- Argentina-Uruguay- Tietê – Paraná 1.491 Brazil-Paraguay
I TAI PU BI NACI ONAL
POW ER: 7 .0 0 0 MW ENERGY: 3 7 .5 0 0 GW h/ YEAR PARTI CI PATI ON: 8 5 %
Source: Administración Nacional de Electricidad (www.ande.gov.py)
ENTI DAD BI NACI ONAL YACYRETA
FI NAL POW ER: 1 .5 5 0 MW FI NAL ENERGY: 1 0 .5 0 0 GW h/ AÑO PARTI CI PATI ON: 1 0 %
CENTRAL ACARAY
FI NAL POW ER: 2 5 2 MW ENERGY: 9 5 0 GW h/ YEAR PARTI CI PATI ON: 5 % PARTI CI PATI ON: 8 5 %
Electro Intensive Industrial.
(Reglamentado por el Decreto 7.406/11)
No Electro Intensive Industrial
Fajas de Consumo Precio
1 – 50 MWh 225,18 G/MW/h 51 – 500 MWh 252,87 G/MW/h Más de 500 MWh 296,56 G/MW/h
Zonas Franja de Modulación Precio
Este y Sur 0 a 25 % 33,01 US$/MWh
Residential
Fuente: Elaboración propia con datos proveídos por técnicos de la ANDE
Este y Sur 0 a 25 % 33,01 US$/MWh Este y Sur 26 a 50 % 37,70 US$/MWh Central 0 a 25 % 35,50 US$/MWh Central 26 a 50 % 40,78 US$/MWh Metropolitana 0 a 25 % 37,00 US$/MWh Metropolitana 26 a 50 % 42,85 US$/MWh
Fajas de Consumo Precio
1 – 50 MWh
311,55 G/KWh
51- 150 MWh
349,89 G/KWh
Mas de 150 MWh
365,45 G/KWh
20% 25% 30% 35% 40%
35% 34% 34% 30% 25% 25% 20%
This tax has been lowered 66% from 30% to 10% in 2004
0% 5% 10% 15% Argentina Colombia Brasil Perú Uruguay Ecuador Chile Paraguay
10%
Source: Ministry of Finance – www.hacienda.gov.py
Averiguar Uruguay
25% 30% 35% 40% 40% 35% 35% 30% 27,50% 25% 25%
Source: Ministry of Finance – www.hacienda.gov.py
0% 5% 10% 15% 20% Chile Argentina Colombia Perú Brasil Ecuador Uruguay Paraguay 10%
15% 20% 25% 25% 23% 21% 19% 19% 16%
Source: Ministry of Finance – www.hacienda.gov.py
0% 5% 10% Brasil Uruguay Argentina Chile Perú Colombia Ecuador Paraguay 12% 10%
According to “World According to “World Energy Energy Council”, Council”, Paraguay
Paraguay is the country’s number
is the country’s number
energy production. energy production.
Source: Energy Sustainability Index 2012
Capital with lower cost of life in South America.
Source: Mercer Consulting Group 2012
Source: Riskmap Report 2013, Mercer Consulting Group 2012 & Energy Sustainability Index 2013
BEI – October/2013
1,0 Venezuela 5,7 Colombia 4,5 Mexico 5,0 Ecuador
Favorable Business Environment Favorable Business Environment for Investments for Investments
evaluation, the Business Environment Index (BEI) ranks 6,4 points, over the Latin American average: 4,4 points, according to the report from the Getulio Vargas Foundation (GVF).
4,8 Brazil 6,4 Paraguay 4,8 Uruguay 3,9 Argentina 5,2 Chile 5,4 Bolivia 6,0 Peru Ecuador
*Source: Getulio Vargas Foundation of Brazil (FGV) & University of Munich, Germany
8,3 13,1 13,0 8,0 10,0 12,0 14,0 Growth by decades Growth in the IMF Forecasts Forecasts from the Central Bank of Paraguay
Source: Banco Central del Paraguay - www.bcp.gov.py & IMF
5,1 3,9 2,4 3,0 4,3
4,6 4,7 4,7 4,7 (2,0) 0,0 2,0 4,0 6,0 1960 1970 1980 1990 2000 2010 2011 2012 2013 2014 2015 2016 2017 Growth in the last years IMF Forecasts
Source: Banco Central del Paraguay - www.bcp.gov.py
14,6 9,3 9,9 12,5
10,0 12,0 14,0 16,0
Paraguay Inflation Rate
Source: Banco Central del Paraguay - www.bcp.gov.py *Projection for 2013 according BCP Preliminary Balance
2,8 6,0 7,5 1,9 7,2 4,9 4,0 5,0
0,0 2,0 4,0 6,0 8,0 2002 2003 2004 2005 2006 2007 2008 2009 2010 2011 2012 2013*
Inflation %
“We are affirming our ’BB-/B’ foreign and local currency sovereign credit ratings on Paraguay. In our opinion, the impact of former Paraguayan president Lugo’s rapid impeachment in June has been and will remain limited. The stable outlook balances the country’s narrow economy and substantial infrastructure needs against the government’s i mproving fiscal underpinnings and low debt… At the same t ime, the country’s external indicators have continued to stre ngthen as a result of solid export growth…and rising interna tional reserves, which now cover more than five months of c urrent account
Evolution of the Country Rating** Outlook Rating Agencies
5 6 7 8 9 10 11 2006 2007 2008 2009 2010 2011 2012 2013 Ba2/BB Ba3/BB- B1/B+ B2/B B3/B-
S&P Moody’s Fitch
urrent account payments.” S&P January 2013 “Moody’s …has upgraded Paraguay’s government bond rating to Ba3 from B1. The key drivers supporting the upgrade are (1) government finances that we expect will continue to align well with peers in the ‘Ba’ rating category, despite volatile growth, (2) a sustained build-up in international reserves and (3) improved medium-term growth prospects supported by government plans to increase investment in infrastructure” Moody’s January 2013
Regional Comparison (Moody’s /S&P) (1)
Source: Central Bank of Paraguay, EIU, Moody’s, S&P. (1) Foreign Currency Long Term rating
** Based on LT Currency Debt; A securities rating is not a recommendation to buy, sell or hold securitiesand may be subject to revision or withdrawal at any time.
5 6 7 8 9 10 11 Argentina B3 / B- Ecuador Caa1 / B Bolivia Ba3 / BB- Uruguay Baa3 / BBB- Brazil Baa2 / BBB Paraguay Ba3 / BB- Chile Aa3 / AA- Peru Baa2 / BBB Colombia Baa3 / BBB- Venezuela B2 / B+
1,4% 0,7% 0,4% 0,9% 2,3% 0,1% 1,2% 0,7%
0,0% 1,0% 2,0% 3,0%
2000 2001 2002 2003 2004 2005 2006 2007 2008 2009 2010 2011 2012*
IB IB
Source: Ministerio de Hacienda (www.hacienda.gov.py)
2000 2001 2002 2003 2004 2005 2006 2007 2008 2009 2010 2011 2012*
% PIB % PIB
170,8 182,8 213,7 289,5 299,0 356,0 251,9 204,7 175,7
200,0 250,0 300,0 350,0 400,0
Source: Ministerio de Hacienda (www.hacienda.gov.py)
118,8 127,1 131,7 170,8 182,8 175,7 131,5 89,6 78,0 57,9 56,0 45,8 45,0 47,2
0,0 50,0 100,0 150,0 200,0
Required national components:
materials
components
Freights*
40% 50% 60% 70%
Necessary regional (MERCOSUR) content %
Paraguay has a “special treatment” regarding “rules of origin” of manufactured
products until 2023
It is easier for a product to acquire “MERCOSUR origin” in Paraguay than in other
member country
* If the service is provided by a Company established in Paraguay
Source: Mercosur 01/04 decision – www.mercosur.int
Required national components:
materials
components
Freights*
Extra-zone imported components allowed in product
0% 10% 20% 30%
Brasil Argentina Uruguay Paraguay
60% 60% 50% 40%
(machinery & equipment) (machinery & equipment)
(in or out of the country)
(applied for investments over US$ 5 Mill. for 10 years)
Source: Ministry of Finance – www.hacienda.gov.py
(capital, interest & commissions)
(in or out of the country)
Contract
MAQUILA ENTERPRISE HEAD OFFICE
ENTERPRISE / PERSON CONTRACTED Legally domiciled in the Paraguayan territory
ENTERPRISE CONTRACTOR ABROAD TO PRODUCE:
“FOR EXPORT” Contract
ENTERPRISE OFFICE
SUB MAQUILA ENTERPRISE
Single tax rate of 1% over sales invoicing Only “value added” considered in tax calculation
ENTERPRISE / PERSON CONTRACTED trhougth the Maquila Enterprise TO MAKE Partials processes or Underprocesses
National Market
(max. 10% of Production previous year)
Product
Market export
previous year)
Other Countries Goods and Services Labor Capital Goods Inputs commodities
MAQUILA ENTERPRISE
National provision
HEAD OFFICE
Duties and Taxes SUSPENDED = Warranty
Fuente: CNIME
(regarding billing)
RECEIPT MAQUILA LABOR + GOODS AND SERVICES + DEPRECIATION + MAQUILA SERVICE RECEIPT RECEIPT submaquila submaquila LABOR + GOODS AND SERVICES + DEPRECIATION + submaquila SERVICE
Fuente: CNIME
Free Zone
Service suppliers inside ZF Clients inside ZF
0% Impuesto 0% Taxes
0% Taxes
Importación Export
Machineries, capital, raw material enter with 0% of taxes. 0,5% taxes on invoice value
Fuente: Ley523/95 -Consejo Nacional de Zonas Francas
Stock of imported raw materials and imputs
A B C Paraguay Paraguay
Finished Products customers in customers in Paraguay Paraguay International International customers customers Services Suppliers in Paraguay International services suppliers
Exchange of goods and services between users inside the Zona Franca
while stored inside ZF.
CustomsTaxes InternalTaxes (during the stay of the goods in the free zone)
Distribution and logistics centers Services (Call Centers, Financial, Home Office) Light Manufacturing Tourist Offices
CustomsTaxes InternalTaxes (during the stay of the goods in the free zone)
Distribution and logistics centers Services (Call Centers, Financial, Home Office) Light Manufacturing Tourist Offices
Tax Invoice value
Fuente::Oficina de Zona Franca
the MERCOSUR.
Complementation Agreements - ECAs.
as
Partner Observer tot the Pacific Alliance.
beneficiary countries of the EU.
Meat Meat & Leather Leather Tourism Tourism Biofuels Biofuels Meat Meat & Leather Leather Forest Forest Products Products Tourism Tourism Cotton, textil & Cotton, textil & apparel apparel Biofuels Biofuels TIC’s TIC’s
Stevia Stevia Fruits Fruits & Vegetables & Vegetables Infraestructure Infraestructure Ecoturism Ecoturism Metalurgic Metalurgic Call Call Centers Centers Oils Oils Energy Energy
clean and renewable.
training.
lowest tax burden in the region.
high productivity and capacity expansion.
MERCOSUR.
throughout the year for river-sea trade. 10.Good levels of quality of life and safety.
BANCO DO BRASIL
Asunción – Paraguay Tel: + (595 21) 616 3000 Telefax: + (595 21) 616 3000 www.mic.gov.py
Asunción – Paraguay Tel: + (595 21) 616 3006 Telefax: + (595 21) 616 3034 www.rediex.gov.py info@rediex.gov.py
Asunción – Paraguay Tel: + (595 21) 616 3000 Telefax: + (595 21) 616 3000 www.mic.gov.py
Asunción – Paraguay Tel: + (595 21) 616 3006 Telefax: + (595 21) 616 3034 www.rediex.gov.py info@rediex.gov.py