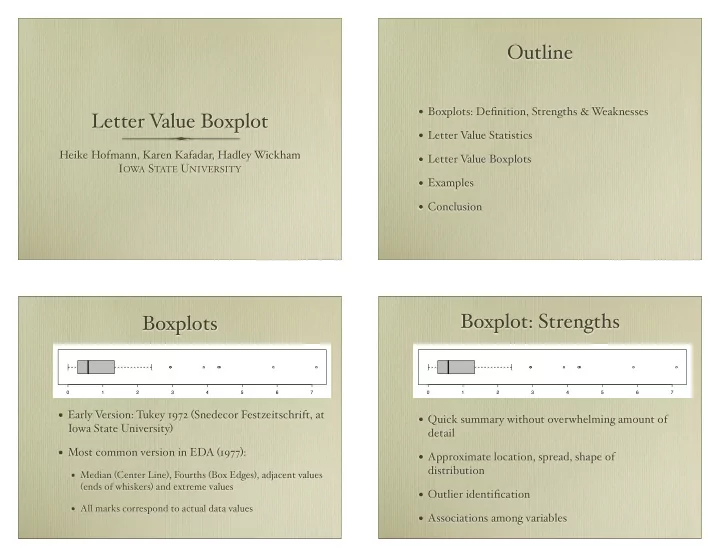
outline
play

Outline Boxplots: De fi nition, Strengths & W eaknesses Letter - PowerPoint PPT Presentation

Outline Boxplots: De fi nition, Strengths & W eaknesses Letter V alue Boxplot Letter V alue Statistics Heike Hofmann, Karen Kafadar, Hadley Wickham Letter V alue Boxplots I OWA S TATE U NIVERSITY Examples Conclusion


  1. Outline • Boxplots: De fi nition, Strengths & W eaknesses Letter V alue Boxplot • Letter V alue Statistics Heike Hofmann, Karen Kafadar, Hadley Wickham • Letter V alue Boxplots I OWA S TATE U NIVERSITY • Examples • Conclusion Boxplot: Strengths Boxplots 0 1 2 3 4 5 6 7 0 1 2 3 4 5 6 7 • Early V ersion: Tukey 1972 ( Snedecor Festzeitschrift, at • Quick summary without overwhelming amount of Iowa State University ) detail • Most common version in EDA ( 1977 ) : • Approximate location, spread, shape of distribution • Median ( Center Line ) , Fourths ( Box Edges ) , adjacent values ( ends of whiskers ) and extreme values • Outlier identi fi cation • All marks correspond to actual data values • Associations among variables

  2. Boxplots: W eaknesses Modi fi cations • Expected rate of labeled outliers approx 0.4+ 0.007n • Notched box - and - whisker ( McGill, Larsen, Tukey 1987 ) • For n = 100000 expect approx. 700 outliers! • Nonparametric density estimates 12 • V ase plots ( Benjamini, 1988 ) 5 8 10 6 4 • Violin plots ( Hintze, Nelson 1998 ) 6 8 3 4 Exponential 6 4 • Box - percentile plots ( Esty, Ban fi eld 2003 ) 2 Distribution, 4 2 2 Implementations: S routines ( David James ) , package vioplot ( Adler, 1 n= 100, 1000, 2 Romain ) , package HMisc bpplot ( Harre � , Ban fi eld ) , examples at R 10000, 100000 0 0 0 0 Graph Ga � ery Letter V alue Statistics Letter V alue Boxplot LVboxplot(rnorm(1000)) • Estimate quantiles corresponding to tail areas 2 - j • Median ( 1/2 ) : depth = d M = (1 + n ) / 2 • Fourths ( 1/4 ) : depth = d F = (1 + ⌊ d M ⌋ ) / 2 -3 -2 -1 0 1 2 3 • Eights ( 1/8 ) : depth = d E = (1 + ⌊ d F ⌋ ) / 2 x • Boxplots show median, fourths • How many boxes to show? • Large Data Sets: tail quantiles become more reliable • Outlier identi fi cation? include LV s beyond Fourths • All marks are based on actual data values

  3. Gaussian, Exponential & Normal Stopping Rules & Outliers Gaussian, n=10000 • EDA: 5 - 8 outliers k = ⌊ log 2 n ⌋ − 4 -3 -2 -1 0 1 2 3 -3 -2 -1 0 1 2 3 x � • Percentage of data, e.g. 0.5 - 1 % Exponential, n=10000 • uncertainty in LV i extends beyond or into LV i - 1 ( i.e. upper limit for LV i crosses LV i - 1 ) 0 2 4 6 8 0 2 4 6 8 � � �� 4 z 2 k = log 2 n − log 2 + 1 x 1 − α / 2 Uniform, n=10000 Rules lead to similar answers ... Examples 0.0 0.2 0.4 0.6 0.8 1.0 0.0 0.2 0.4 0.6 0.8 1.0 x Gene Expression V alues Conclusion Letter V alue Boxplots are T1-1 T1-2 T1-3 T2-1 T2-2 T2-3 WT-1 WT-2 WT-3 • appropriate for large number of values 14 14 14 14 14 14 14 14 14 • based on actual data values 12 12 12 12 12 12 12 12 12 • simple to compute 10 10 10 10 10 10 10 10 10 x x x x x x x x x • reduce number of labeled outliers shown in conventional boxplots 8 8 8 8 8 8 8 8 8 • do not depend on a smoothing parameter 6 6 6 6 6 6 6 6 6 Download ( for now ) at http://www.public.iastate.edu/ ~ hofmann

  4. Graphical Displays of Large Data Sets “ The greatest value of a picture us when it forces us to notic e w hat we never expected to see ” ( Tukey 1977 ) • Quick summary without overwhelming amount of detail • Approximate location, spread, shape of distribution • Outlier identi fi cation • Associations among variables

Download Presentation
Download Policy: The content available on the website is offered to you 'AS IS' for your personal information and use only. It cannot be commercialized, licensed, or distributed on other websites without prior consent from the author. To download a presentation, simply click this link. If you encounter any difficulties during the download process, it's possible that the publisher has removed the file from their server.

Recommend


More recommend