outline
play

Outline 1) Introductions 2) Program Background 3) Frequently Asked - PowerPoint PPT Presentation

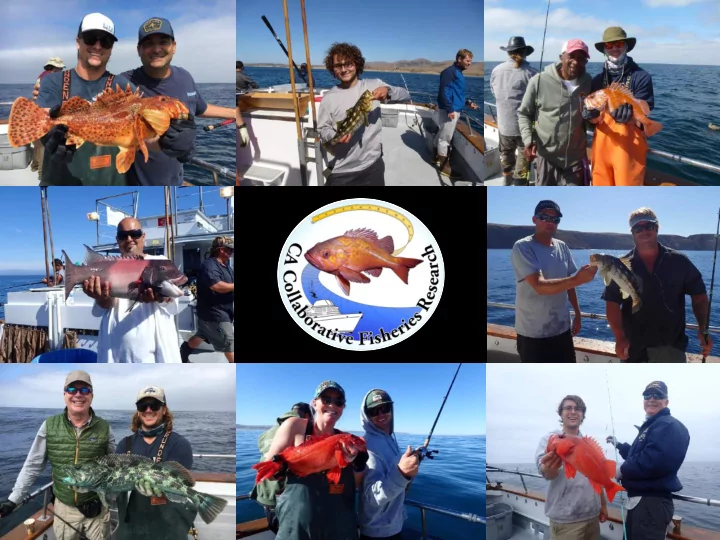
Outline 1) Introductions 2) Program Background 3) Frequently Asked Questions 4) Data Summaries Introductions 1. Name 2. Affiliation (e.g. Captain, Deckhand, Volunteer Angler, Science Crew, etc.) 3. Where is your favorite place to fish?


  1. Outline 1) Introductions 2) Program Background 3) Frequently Asked Questions 4) Data Summaries

  2. Introductions 1. Name 2. Affiliation (e.g. Captain, Deckhand, Volunteer Angler, Science Crew, etc.) 3. Where is your favorite place to fish?

  3. California Collaborative Fisheries Research Program (CCFRP) • Fishery-independent (catch-and-release) study that combines the expertise and ideas of: - the fishing community - academic scientists - resource managers • Conducts scientifically rigorous data collection and analyses for MPA monitoring and fisheries management

  4. Benefits of Collaboration • Engage stakeholders in both science and management • Utilize different areas of expertise to develop protocols and collect data • Create a shared understanding of resources and facilitate communication

  5. California Collaborative Fisheries Research Program (CCFRP)

  6. California MPAs Marine Life Protection Act (MLPA) passed in 1999 mandated the creation of a network of marine protected areas (MPAs) along the California coast to protect diversity and ecosystem function

  7. Why Monitor MPAs? 1. It is a priority adopted by the state of California 2. It is required by MLPA 3. Critical to seeing the effects of the MPA network in action

  8. Northern California 20 – est. 2012 California MPA Network North Central California 25 – est. 2010 Central California 29 – est. 2007 Southern California 50 – est. 2012

  9. Marine Protected Area (MPA) vs. Reference Site (REF) State Marine Reserve (SMR) – fully protected; all commercial and recreational harvest prohibited State Marine Conservation Area (SMCA) – limited recreational and/or commercial extraction permitted State Marine Park (SMP) – recreational harvest permitted Fished Areas – areas open to both recreational and commercial fishing; subject to California Dept. of Fish and Wildlife (CDFW) rules and regulations (e.g., minimum/maximum sizes, seasonal closures, daily bag limits)

  10. Statewide Monitoring Network

  11. Channel Islands MPAs

  12. CCFRP Sampling Design Site Grid Cell (x4) Region Area Location (x3) MPA Drift (15 min / location) North Point Conception SMR REF Carrington Point SMR Anacapa SMR & SMCA Central South

  13. Why Can’t We Fish Wherever We Want? • • Utilize seafloor maps Returning to the same cells each year allows us to determine available to compare data and reef habitat monitor change over time • Overlay isobaths of targeted depth (10-50 meters) • Designate 500 x 500 m cells over rocky habitat in our depth zone

  14. UCSB Study Sites Sample Cells 50 m isobath Rocky Reef 10 m isobath

  15. UCSB Study Sites Sample Cells Isobaths Rock

  16. UCSB Study Sites Rock Sample Cells 10 and 50 m contour

  17. Why Can’t I Fish My Own Tackle? HSU: Fly, Baited Fly , • Standardization, Bars, Swimbaits reproducibility, and UCD: Fly, Baited Fly , historical precedent Bars MLML: Fly, Baited Fly , • Bars Allows us to compare data on a Cal Poly: Fly, Baited Fly , Bars state and regional scale UCSB: Dropper Loop, Baited Fly , Swimbaits Scripps: Dropper Loop, Baited Fly , Swimbaits

  18. Catch by Gear Type 2017 & 2018

  19. Catch by Gear Type 2017 & 2018

  20. Catch by Gear Type 2017 & 2018

  21. Catch by Gear Type 2017 & 2018

  22. Catch by Gear Type 2017 & 2018

  23. Why Doesn’t Chris Handle any Fish? • Data is important! • The data recorder is responsible for: • Tracking angler on/off time • Ensuring drift is within cell coordinates • Keeping an eye out for incorrect tackle types, un- crimped hooks, etc.

  24. The Data Sheet

  25. The Data Sheet Drift data Fish data Notes

  26. The Data Sheet Total length of each fish Shorthand for each species Station number for each catch

  27. The Data Sheet Condition “codes” used to asses fish Tag ID number GPS Waypoints recorded

  28. Here Comes the Data!

  29. Catch Per Unit Effort (CPUE) • One of the best ways to assess a fishery is to look at relative fish abundance • How we measure it: CPUE = X

  30. Total CPUE by Site Units and scaling may change from plot to plot! “Warmer” “Colder”

  31. CA Sheephead CPUE • We can also look at CPUE for individual species • Strong differences in MPA and REF CPUE may signal an MPA effect

  32. Copper Rockfish CPUE • Some species prefer certain oceanographic conditions

  33. Kelp Bass CPUE • Targeted species may show a strong response to protection

  34. Lingcod CPUE • Other targeted species may not show a response at all

  35. Ocean Whitefish CPUE • Differences in CPUE between islands may reflect differences in fishing pressure

  36. Fish Length • Size is often one of the first metrics to respond to protection • We measure fish by their Total Length (TL) to the nearest centimeter TL (cm) = Tip of the snout to the end of the caudal fin Mouth closed Tail splayed flat

  37. Ocean Whitefish Length 37 cm (14.5 in) 36 cm (14 in) 37 cm 30.5 cm (12 in) (14.5 in) • Differences in mean length between MPA and Reference sites may indicate a potential MPA effect

  38. CA Sheephead Length 55 cm 55 cm (21.6 in) (21.6 in) 56 cm 38 cm (22 in) (15 in) • Like with CPUE, some species may respond strongly to protection at certain sites

  39. Copper Rockfish Length 36 cm (14 in) 37 cm (14.5 in) 30 cm (11.8 in) 35 cm (13.7 in) • The more individuals we catch, the cleaner the distribution becomes

  40. Lingcod Length 60 cm (23.6 in) 63 cm (24.8 in) • Large individuals outside of the MPA may indicate a possible spillover effect of certain targeted species

  41. Blue Rockfish Length 24 cm (9.4 inches) 29 cm (11.4 inches) • Other species may not show a response to protection at all

  42. Going Forward • CCFRP is designed as a long term monitoring project Central • MLML and Cal Poly have California 29 – est. 2007 been monitoring MPAs on the central coast since 2007 • Let’s look at some of their data

  43. Blue Rockfish Mean CPUE • These time series plots allow us to track change over time • Once again we can see if MPAs appear to be affecting CPUE

  44. Blue Rockfish Mean CPUE • These plots track responses to large El Nino scale events and Years environmental disasters such as climate change and oil spills

  45. Black Rockfish Size Structure • We can also gather interesting information on the life history of different species • This can in turn be used to inform policy and regulation

  46. But one metric is clearly the most important…..

  47. Who Caught the Most Fish? Angler Number of Fish Caught in 2018 John H. 191 John S. 188 Wayne K. 177 Bill P. 148 Gavin C. 141 Russel P. 137 Whitney U. 129 Jim S. 119 April B. 111 Rudy T. 102 Hannah K. 101

  48. Who Caught the Biggest Fish? Angler Winning Catch by Species John T. Thresher Shark (210 cm/83 in) Butch B. Soupfin Shark (160 cm/63 in) Russel P. Lingcod (92 cm/36 in) Zack E. Halibut (86 cm/34 in) Whitney U. Lingcod (77 cm/30 in) Jim S. California Sheephead (75 cm/30 in)

  49. Who Caught the Smallest Fish? Trophy Catch by Species Angler Rudy T. Pacific Sanddab (10 cm) Wayne K. Blue Rockfish (10 cm) John S. Vermillion Rockfish (10 cm) Jim S. Sr Pacific Sanddab (11 cm) Andy M. Blue Rockfish (15 cm)

  50. Follow Us! @Casellelab and @CCFRP Thanks for joining us!

  51. Why Don’t We Tag All the Fish? • Maximize survivorship and minimize stress • Not tagged if: • Less than 25 cm • Experiencing injury or barotrauma • Species not of interest (i.e. Mackerel, Sanddabs, etc.)

  52. Tag Returns Highlights From 2017! Amazing recapture from Bodega Bay! They recaptured a Copper Rockfish at Stewart’s Point that was originally tagged by Cal Poly in the Piedras Blancas MPA on 8/20/13! In its 1,500 days (4+ years) at liberty, it swam ~220 miles and grew 13 cm!

Download Presentation
Download Policy: The content available on the website is offered to you 'AS IS' for your personal information and use only. It cannot be commercialized, licensed, or distributed on other websites without prior consent from the author. To download a presentation, simply click this link. If you encounter any difficulties during the download process, it's possible that the publisher has removed the file from their server.

Recommend


More recommend