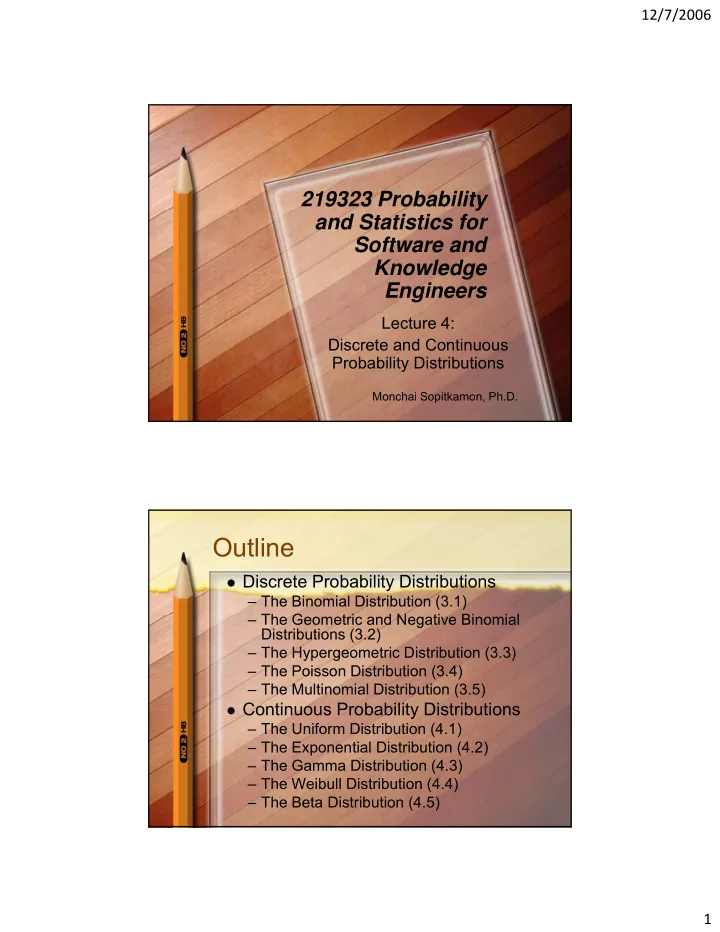
Outline Discrete Probability Distributions The Binomial - - PDF document

outline
SMART_READER_LITE
LIVE PREVIEW

Outline Discrete Probability Distributions The Binomial - - PDF document

12/7/2006 219323 Probability y and Statistics for Software and Knowledge Engineers Lecture 4: Discrete and Continuous Probability Distributions Monchai Sopitkamon, Ph.D. Outline Discrete Probability Distributions The Binomial


slide-1
SLIDE 1

12/7/2006 1

219323 Probability y and Statistics for Software and Knowledge Engineers

Lecture 4: Discrete and Continuous Probability Distributions

Monchai Sopitkamon, Ph.D.

Outline

Discrete Probability Distributions

– The Binomial Distribution (3.1) Th G t i d N ti Bi i l – The Geometric and Negative Binomial Distributions (3.2) – The Hypergeometric Distribution (3.3) – The Poisson Distribution (3.4) – The Multinomial Distribution (3.5)

Continuous Probability Distributions

– The Uniform Distribution (4.1) – The Exponential Distribution (4.2) – The Gamma Distribution (4.3) – The Weibull Distribution (4.4) – The Beta Distribution (4.5)

slide-2
SLIDE 2

12/7/2006 2

Discrete Probability Distributions: The Binomial Distribution I (3.1)

Bernoulli RVs

– Discrete RVs that take just two values – Can be used to model the outcome of a coin toss, whether an item is defective or not, whether a student will pass or fail this course, and etc. – Outcomes are labeled 0 and 1 with parameter p (0 ≤ p ≤ 1) specifying the prob that the outcome is 1 that the outcome is 1 – E(X) = (0xP(X=0))+ (1xP(X=1)) = p – E(X2) = (02xP(X=0))+ (12xP(X=1)) = p – Var(X) = E(X2) – (E(X))2 = p – p2 = p(1 – p)

Discrete Probability Distributions: The Binomial Distribution II (3.1)

If n independent Bernoulli trials are

performed, each with a constant prob p f “ ” h h RV X X

  • f “success”, then the RV X = X1+…+

Xn has a binomial distribution with parameters n and p

X ∼ B(n, p) counts the number of

successes in the n trials

Pmf of a B(n, p) RV:

x n x

p p n x X P

⎟ ⎟ ⎞ ⎜ ⎜ ⎛ = = ) 1 ( ) (

( , p)

E(X) = E(X1)+…+ E(Xn) = p +…+ p = np Var(X) = Var (X1) +…+ Var(Xn) = p(1-p)

+…+ p(1-p) = np(1-p)

p p x x X P − ⎟ ⎟ ⎠ ⎜ ⎜ ⎝ = = ) 1 ( ) (

slide-3
SLIDE 3

12/7/2006 3

Discrete Probability Distributions: The Binomial Distribution III (3.1)

X ∼ B(4,p)

Discrete Probability Distributions: The Binomial Distribution IV (3.1)

Symmetric Prob Distribution B(n, 0.5) with respected to E(X)=n/2

P(X≥6) = 1-P(X≤5) = 1-0.855 = 0.145

Figure 3.2 Probability mass function and cumulative distribution

function of a B(8, 0.5) random variable

slide-4
SLIDE 4

12/7/2006 4

Discrete Probability Distributions: The Binomial Distribution V (3.1)

5 3 5 3

3 2 3 1 ! 5 ! 3 ! 8 3 1 1 3 1 3 8 ) 3 ( ⎟ ⎠ ⎞ ⎜ ⎝ ⎛ ⎟ ⎠ ⎞ ⎜ ⎝ ⎛ = ⎟ ⎠ ⎞ ⎜ ⎝ ⎛ − ⎟ ⎠ ⎞ ⎜ ⎝ ⎛ ⎟ ⎟ ⎠ ⎞ ⎜ ⎜ ⎝ ⎛ = = X P

= 0.273 P(X≤1) = P(X=0) + P(X=1) = 0.039 + 0.156 = 0.195 Figure 3.3 Probability mass function and cumulative distribution

function of a B(8, 1/3) random variable

Discrete Probability Distributions: The Binomial Distribution VI (3.1)

P(X=4) = 0.171

P(X≤2) = P(X=0) + P(X=1) + P(X=2) = 0 001 + 0 002 + 0 017 0.001 + 0.002 + 0.017 = 0.020 Figure 3.4 Probability mass function and cumulative distribution

function of a B(8, 2/3) random variable

slide-5
SLIDE 5

12/7/2006 5

Discrete Probability Distributions: The Binomial Distribution VII (3.1)

  • Ex. If the probability of a student successfully

passing this course (C or better) is 0.82, find the passing this course (C or better) is 0.82, find the probability that given 8 students

  • a. all 8 pass.
  • b. none pass.

( ) ( )

8

8 0.82 0.18 8 ⎛ ⎞ ⎜ ⎟ ⎝ ⎠

( ) ( )

8

8 0.82 0.18 ⎛ ⎞ ⎜ ⎟ ⎝ ⎠

0.2044 ≈ 0.0000011 ≈

  • c. at least 6 pass.

( ) ( ) ( ) ( ) ( ) ( )

6 2 7 1 8

8 8 8 0.82 0.18 0.82 0.18 0.82 0.18 6 7 8 ⎛ ⎞ ⎛ ⎞ ⎛ ⎞ + + ⎜ ⎟ ⎜ ⎟ ⎜ ⎟ ⎝ ⎠ ⎝ ⎠ ⎝ ⎠

0.2758 0.3590 0.2044 ≈ + +

= 0.8392

Outline

Discrete Probability Distributions

– The Binomial Distribution (3.1) Th G t i d N ti Bi i l – The Geometric and Negative Binomial Distributions (3.2) – The Hypergeometric Distribution (3.3) – The Poisson Distribution (3.4) – The Multinomial Distribution (3.5)

Continuous Probability Distributions

– The Uniform Distribution (4.1) – The Exponential Distribution (4.2) – The Gamma Distribution (4.3) – The Weibull Distribution (4.4) – The Beta Distribution (4.5)

slide-6
SLIDE 6

12/7/2006 6 Discrete Probability Distributions: The Geometric Distribution I (3.2.1)

The number of trials up to and including

the first success in a sequence of the first success in a sequence of independent Bernoulli trials with a constant success prob p has a geometric dist w/ parameter p

The pmf P(X = x) = (1 – p)x-1p for x = 1,

2, 3, 4,… p p x X P

x 1

) 1 ( ) (

− = =

The cdf

X ≤ x) = 1 – (1 – p)

x

p x X P ) 1 ( 1 ) ( − − = ≤

p X E 1 ) ( =

2

) 1 ( ) ( p p X Var − =

Discrete Probability Distributions: The Geometric Distribution II (3.2.1)

Prob getting head the first time after 3 failures = P(X=4) = (1-p)4-1p

3

= (1/2)3x(1/2) = 1/16

Figure 3.11 Probability mass function and cumulative distribution

function of a geometric distribution with parameter p = 1/2

slide-7
SLIDE 7

12/7/2006 7 Discrete Probability Distributions: The Negative Binomial Distribution I (3.2.2)

The number of trials that gives r

successes in a sequence of successes in a sequence of independent Bernoulli trials w/ a constant success prob p has a negative binomial dist w/ parameters p and r.

The pmf

( )

r r x

p p x x X P

⎟ ⎟ ⎞ ⎜ ⎜ ⎛ − = = 1 1 ) (

The pmf

for x = r, r + 1, r + 2, …

E(X) = r/ and

( )

p p r x X P − ⎟ ⎟ ⎠ ⎜ ⎜ ⎝ − = = 1 1 ) ( p r X E = ) (

2

) 1 ( ) ( p p r X Var − = Discrete Probability Distributions: The Negative Binomial Distribution II (3.2.2)

Modeling number of tosses of a fair coin until until two heads are obtained.

1 5 5 1 ) 2 (

2

⎟ ⎞ ⎜ ⎛ X P 4 5 . 5 . 1 ) 2 (

2

= × × ⎟ ⎟ ⎠ ⎞ ⎜ ⎜ ⎝ ⎛ = = X P

Figure 3.13 Probability mass function and cumulative distribution function of a negative binomial distribution with parameters p = ½ and r = 2

slide-8
SLIDE 8

12/7/2006 8 Discrete Probability Distributions: The Negative Binomial Distribution III (3.2.2)

  • Ex. 12 pg.163: p = 0.6, r = 3

P b th t tl i l Prob that exactly six people need to be interviewed is The expected number of interviews required is

138 . 6 . 4 . 2 5 ) 6 (

3 3

= × × ⎟ ⎟ ⎠ ⎞ ⎜ ⎜ ⎝ ⎛ = = X P

interviews required is

5 6 . 3 ) ( = = = p r X E

Discrete Probability Distributions: The Negative Binomial Distribution IV (3.2.2)

Figure 3.16 Probability mass function of a negative binomial distribution with

parameters p = 0.6 and r = 3, the distribution of the number of applicants interviewed

slide-9
SLIDE 9

12/7/2006 9

Outline

Discrete Probability Distributions

– The Binomial Distribution (3.1) Th G t i d N ti Bi i l – The Geometric and Negative Binomial Distributions (3.2) – The Hypergeometric Distribution (3.3) – The Poisson Distribution (3.4) – The Multinomial Distribution (3.5)

Continuous Probability Distributions

– The Uniform Distribution (4.1) – The Exponential Distribution (4.2) – The Gamma Distribution (4.3) – The Weibull Distribution (4.4) – The Beta Distribution (4.5)

Discrete Probability Distributions: The Hypergeometric Distribution I (3.3)

Used when selecting a group of identical r

items out of a total of N objects, and

If n items are chosen at random without If n items are chosen at random without

replacement (prob of “success” is NOT constant), then

We have a hypergeometric distribution of the

number of items of a certain kind in a random sample of size n drawn without replacement from a population of size N that contains r items of this kind.

⎞ ⎛ ⎞ ⎛

The pmf is

for max(0, n+r-N) ≤ x ≤ min(n, r) ⎟ ⎟ ⎠ ⎞ ⎜ ⎜ ⎝ ⎛ ⎟ ⎟ ⎠ ⎞ ⎜ ⎜ ⎝ ⎛ − − × ⎟ ⎟ ⎠ ⎞ ⎜ ⎜ ⎝ ⎛ = = n N x n r N x r x X P ) (

slide-10
SLIDE 10

12/7/2006 10

Discrete Probability Distributions: The Hypergeometric Distribution II (3.3)

The expected value is

The expected value is

The variance of

N nr X E = ) (

⎟ ⎞ ⎜ ⎛ − × × × ⎟ ⎞ ⎜ ⎛ − = r r n n N X Var 1 ) ( ⎟ ⎠ ⎜ ⎝ × × × ⎟ ⎠ ⎜ ⎝ − N N n N X Var 1 1 ) (

Discrete Probability Distributions: The Hypergeometric Distribution III (3.3)

Ex.17 pg.168: N = 16 r = 6 n = 5 N = 16, r = 6, n = 5

412 . ! 11 ! 5 ! 16 ! 7 ! 3 ! 10 ! 4 ! 2 ! 6 5 16 3 10 2 6 ) 2 ( = ⎟ ⎠ ⎞ ⎜ ⎝ ⎛ ⎟ ⎠ ⎞ ⎜ ⎝ ⎛ × ⎟ ⎠ ⎞ ⎜ ⎝ ⎛ = ⎟ ⎟ ⎠ ⎞ ⎜ ⎜ ⎝ ⎛ ⎟ ⎟ ⎠ ⎞ ⎜ ⎜ ⎝ ⎛ × ⎟ ⎟ ⎠ ⎞ ⎜ ⎜ ⎝ ⎛ = = X P

The expected number of

Figure 3 .1 7 Probability m ass function of the num ber of underw eight m ilk containers in the inspector’s sam ple

p underweight containers chosen by the inspector is

875 . 1 16 6 5 ) ( = × = = N nr X E

slide-11
SLIDE 11

12/7/2006 11

Outline

Discrete Probability Distributions

– The Binomial Distribution (3.1) Th G t i d N ti Bi i l – The Geometric and Negative Binomial Distributions (3.2) – The Hypergeometric Distribution (3.3) – The Poisson Distribution (3.4) – The Multinomial Distribution (3.5)

Continuous Probability Distributions

– The Uniform Distribution (4.1) – The Exponential Distribution (4.2) – The Gamma Distribution (4.3) – The Weibull Distribution (4.4) – The Beta Distribution (4.5)

Discrete Probability Distributions: The Poisson Distribution I (3.4)

Used to model the number of times that

a certain event occurs per unit of time, distance, or volume.

– The number of defects in an item, – The number of radioactive particles emitted by a substance, Th b f t l h ll i d b – The number of telephone calls received by an operator within a certain time period, – The number of customers arriving at a bank during lunch hours.

slide-12
SLIDE 12

12/7/2006 12

Discrete Probability Distributions: The Poisson Distribution II (3.4)

A RV X is distributed as a Poisson

A RV X is distributed as a Poisson RV w/ parameter λ, written as: X ∼ P(λ) has a pmf for x = 0, 1, 2, 3, …

! ) ( x e x X P

x

λ

λ −

= =

λ = = ) ( ) ( X Var X E λ ) ( ) ( X Var X E

Discrete Probability Distributions: The Poisson Distribution III (3.4)

Figure 3.19 Probability mass function and cumulative distribution function of a Poisson random variable with mean λ = 2.0 Figure 3.20 Probability mass function and cumulative distribution function of a Poisson random variable with mean λ = 5.0

180 . 6 8 135 . ! 3 2 ) 3 (

3 2

= × = × = =

e X P

125 . 2 25 1 5 1 1 ! 2 5 ! 1 5 ! 5 ) 2 ( ) 1 ( ) ( ) 2 (

5 2 5 1 5 5

= ⎟ ⎠ ⎞ ⎜ ⎝ ⎛ + + = × + × + × = = + = + = = ≤

− − − −

e e e e X P X P X P X P

slide-13
SLIDE 13

12/7/2006 13

Discrete Probability Distributions: The Poisson Distribution IV (3.4)

Ex.3 pg.174: number of software

Ex.3 pg.174: number of software errors has a Poisson dist w/ λ = 3. Prob that a software has no errors is

The prob that there are three or more

050 . ! 3 ) (

3 3

= = × = =

− −

e e X P

The prob that there are three or more errors in a software is

577 . 423 . 1 2 9 1 3 1 1 1 ! 2 3 ! 1 3 ! 3 1 ) 2 ( ) 1 ( ) ( 1 ) 3 (

3 2 3 1 3 3

= − = ⎟ ⎠ ⎞ ⎜ ⎝ ⎛ + + − = × − × − × − = = − = − = − = ≥

− − − −

e e e e X P X P X P X P

Discrete Probability Distributions: The Poisson Distribution V (3.4)

Figure 3.21 Probability mass function and cumulative distribution function

  • f a Poisson distribution with parameter λ = 3, the distribution of the

number of software errors

slide-14
SLIDE 14

12/7/2006 14

Discrete Probability Distributions: The Poisson Distribution VI (3.4)

Poisson Approximation to Binomial

Poisson Approximation to Binomial Distribution

Suppose that in the binomial pmf B(n, p), we let in such a way that np approaches a value λ = np > 0 Th B( ) P(λ)

and n p → ∞ →

Then B(n, p) P(λ)