SLIDE 9 10/22/2016 9
SC2
M D M D M D M D F F F F L L L L
SC4
M D M D M D M D F F F F L L L L
SC7
L L L L M M M M D D D D F F F F
SC3
M D M D M D M D F L F L F L F L
SC5
M M M M D D D D F L F L F L F L
SC6
M M M M D F D F D F D F L L L L
SC8
M M M M D D D D F L F L F L F L
SC9
M M M M D L D L D L D L F F F F
SC10
M F M F M F M F D L D L D L D L
SC11
M F M F M F M F D D D D L L L L
SC12
M L M L M L M L D F D F D F D F
SC13
M L M L M L M L D D D D F F F F
SC14
M D M D M D M D L L L L F F F F
SC15
M L M L M L M L F F F F D D D D
SC1
M D M D M D M D F L F L F L F L
49
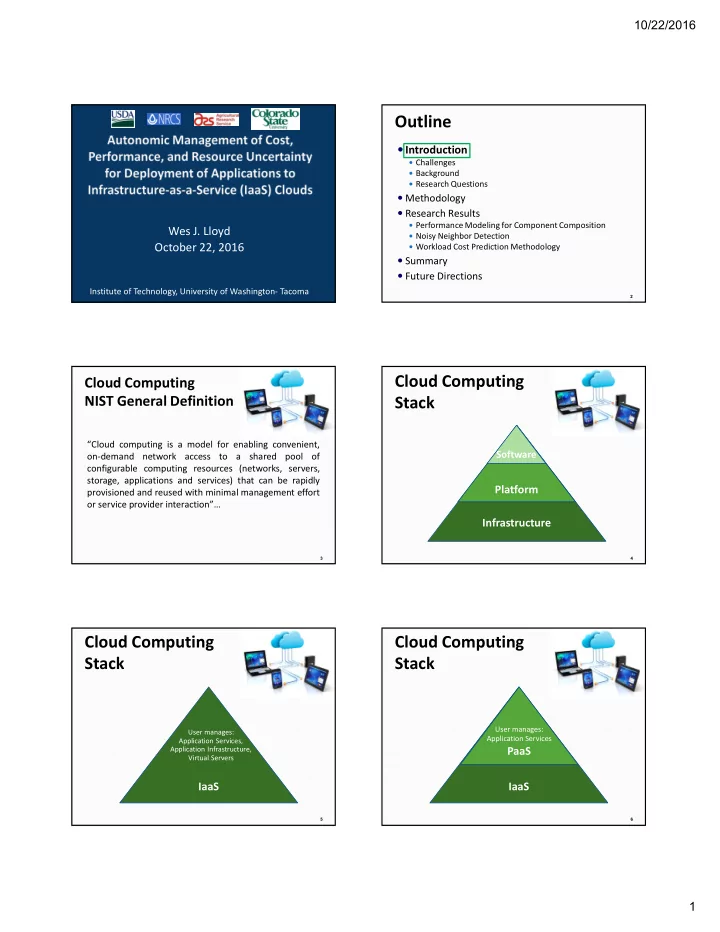
Component Composition Example
- An application with 4 components has 15 compositions
- One or more component(s) deployed to each VM
- Each VM launched to separate physical machine
M: Tomcat ApplicationServer D: Postgresql DB F: nginx file server L: Log server (Codebeamer) SC2
M D M D M D M D F F F F L L L L
SC4
M D M D M D M D F F F F L L L L
SC7
L L L L M M M M D D D D F F F F
SC3
M D M D M D M D F L F L F L F L
SC5
M M M M D D D D F L F L F L F L
SC6
M M M M D F D F D F D F L L L L
SC8
M M M M D D D D F L F L F L F L
SC9
M M M M D L D L D L D L F F F F
SC10
M F M F M F M F D L D L D L D L
SC11
M F M F M F M F D D D D L L L L
SC12
M L M L M L M L D F D F D F D F
SC13
M L M L M L M L D D D D F F F F
SC14
M D M D M D M D L L L L F F F F
SC15
M L M L M L M L F F F F D D D D
SC1
M D M D M D M D F L F L F L F L
50
Component Composition Example
- An application with 4 components has 15 compositions
- One or more component(s) deployed to each VM
- Each VM launched to separate physical machine
M: Tomcat ApplicationServer D: Postgresql DB F: nginx file server L: Log server (Codebeamer)
Bell’s Number:
k: number of ways n components can be distributed across containers n k 4 15 5 52 6 203 7 877 8 4,140 9 21,147 n . . .
51 SC15 SC14 SC13 SC12 SC11 SC10 SC9 SC8 SC7 SC6 SC5 SC4 SC3 SC2 SC1
CPU time disk reads disk writes network reads network writes
52 SC15 SC14 SC13 SC12 SC11 SC10 SC9 SC8 SC7 SC6 SC5 SC4 SC3 SC2 SC1
CPU time disk reads disk writes network reads network writes
Resource utilization profile changes from component composition
M-bound RUSLE2
- Box size shows absolute deviation (+/-) from mean
- Shows relative magnitude of performance variance
53 SC15 SC14 SC13 SC12 SC11 SC10 SC9 SC8 SC7 SC6 SC5 SC4 SC3 SC2 SC1
CPU time disk reads disk writes network reads network writes
∆ Resource Utilization Change
Min to Max Utilization
m-bound d-bound
CPU time: 6.5% 5.5% Disk sector reads: 14.8% 819.6% Disk sector writes: 21.8% 111.1% Network bytes received: 144.9% 145% Network bytes sent: 143.7% 143.9%
Resource Utilization Data Collection
Resource utilization sensors
Sensor on each VM/PM Transmits data to VM-Scaler @
configurable intervals
CPU
- CPU time: (cpuUsr + cpuKrn)
- cpuUsr: CPU time in user mode
- cpuKrn:CPU time in kernel mode
- cpuIdle: CPU idle time
- contextsw: # of context switches
- cpuIoWait: CPU time waiting for I/O
- cpuIntSrvc: CPU time serving interrupts
- cpuSftIntSrvc: CPU time serving soft interrupts
- cpuNice: CPU time executing prioritized processes
- cpuSteal: CPU ticks lost to virtualized guests
- loadavg: (# proc / 60 secs)
Disk
- dsr: disk sector reads
- dsreads: disk sector reads completed
- drm: merged adjacent disk reads
- readtime: time spent reading from disk
- dsw: disk sector writes
- dswrites: disk sector writes completed
- dwm: merged adjacent disk writes
- writetime: time spent writing to disk
Network
- nbs: network bytes sent
- nbr: network bytes received