Outline Detecting Response at the Cellular Level Introduction and - - PDF document

outline
SMART_READER_LITE
LIVE PREVIEW

Outline Detecting Response at the Cellular Level Introduction and - - PDF document

Outline Detecting Response at the Cellular Level Introduction and Motivation Diego Rubn Barrettino, Ph.D. Senior Research Scientist Integrated Systems Laboratory cole Polytechnique Fdral de Lausanne (EPFL) E-mail:


slide-1
SLIDE 1

1

Detecting Response at the Cellular Level

Diego Rubén Barrettino, Ph.D.

Senior Research Scientist Integrated Systems Laboratory École Polytechnique Fédéral de Lausanne (EPFL) E-mail: diego.barrettino@epfl.ch

Outline

  • Introduction and Motivation

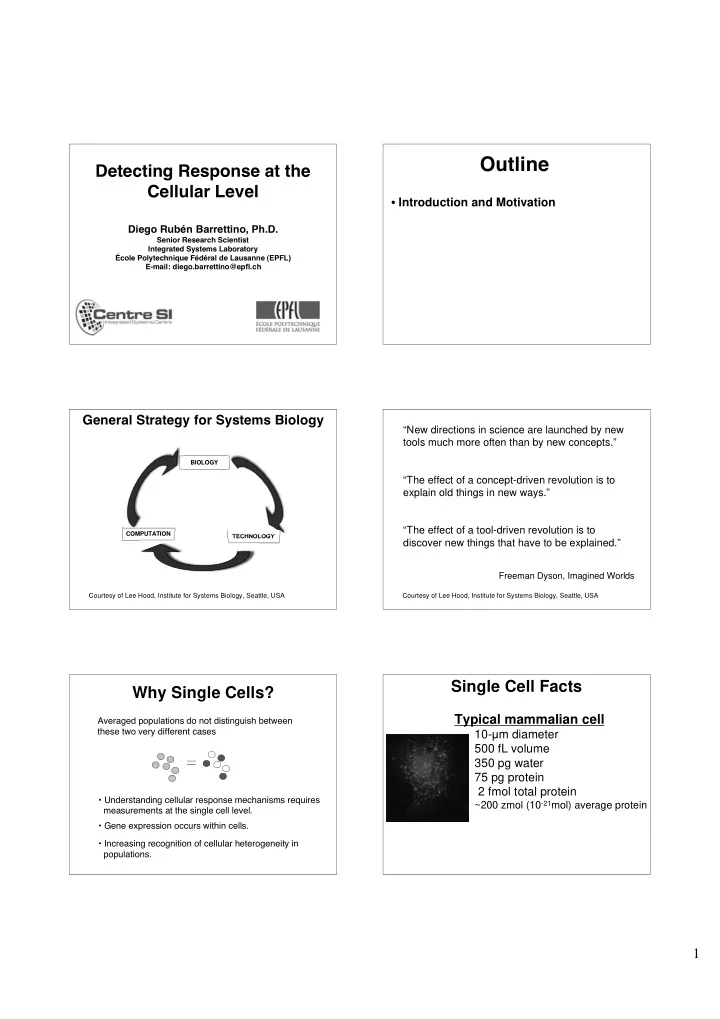
Courtesy of Lee Hood, Institute for Systems Biology, Seattle, USA TECHNOLOGY BIOLOGY COMPUTATION

General Strategy for Systems Biology

“New directions in science are launched by new tools much more often than by new concepts.” “The effect of a concept-driven revolution is to explain old things in new ways.” “The effect of a tool-driven revolution is to discover new things that have to be explained.”

Freeman Dyson, Imagined Worlds

Courtesy of Lee Hood, Institute for Systems Biology, Seattle, USA

Why Single Cells?

  • Understanding cellular response mechanisms requires

measurements at the single cell level. Averaged populations do not distinguish between these two very different cases

  • Increasing recognition of cellular heterogeneity in

populations.

  • Gene expression occurs within cells.

Typical mammalian cell

10-m diameter 500 fL volume 350 pg water 75 pg protein 2 fmol total protein

~200 zmol (10-21mol) average protein

Single Cell Facts

slide-2
SLIDE 2

2

  • Contain a single cell in a device comparable to it’s
  • wn volume.
  • Automatically array and isolate hundreds of

individual cells.

  • Selectively deliver reagents to each cell.
  • Detect nucleic acids and proteins from each cell.

Challenges of Single-Cell Measurements

Outline

  • Technology

Tools for understanding the interconnected pathways from genes to complex cellular processes

  • Passive measurements provide genome-level expression information,

e.g., – Microarrays – 2D protein gels

  • Dynamic measurements provide temporal and spatial patterns of

expression under specific metabolic response regimes, e.g., – Single cell dynamic analyses with fluorescent reporters (e.g. GFP variants) – New methods and instruments are under development.

High-Throughput Biology

Miniaturization Parallelization Integration Automation

  • Microfluidics (devices to do chemistry on the nanoliter scale)
  • Microelectronics
  • Microtechnology (MEMS)

Technologies:

Flow Cytometry

Definition: A technique of rapidly measuring physical and chemical characteristics of cells as they flow in single file through a sensing region. Three Stages:

– Fluidics Control: Positioning of cell sample stream by hydrodynamic or electrokinetic focusing – Optical Detection: Analysis of scattering effects and fluorescence emitted after illumination by light beam – Cell Sorting: Aerosol droplet sorting using electrokinetics

Flow Cytometry

slide-3
SLIDE 3

3

Microfabricated Flow Cytometer

Movie clip: http://www.ece.jhu.edu/faculty/andreou/495/ Figure from Microfabrication Lab, 580.495

Single-Cell Studies

Measurement Procedure

  • 1. Manipulation (Trapping).

Single-Cell Manipulation

  • Optical trapping (Optical Tweezers ).
  • Dielectrophoresis (DEP) trapping.
  • Magnetic trapping.
  • Hydrodynamic trapping.
  • Structural trapping.

Ashkin et al. discovered optical

trapping in 1969 when he found he could manipulate biological particles using infrared (IR) light.

The principle of optical trapping

utilizes the property of radiation pressure which involves focusing

  • ne or more laser beams on a

particle and thereby trapping it.

  • Fig. 1 shows manipulation of

microscopic particles using tweezers Figure 1: Manipulation of yeast cells

Optical Trapping Optical Tweezer Setup

Modern Optical Tweezers: In practice,

  • ptical tweezers are very expensive,

custom-built instruments. High power infrared laser beams are often used to achieve high trapping stiffness with minimal photo-damage to biological samples. Precise steering of the optical trap is accomplished with lenses, mirrors, and acousto/electro-optical devices that can be controlled via computer. Fig. 5 is meant to give an idea of the number of elements in such a system. In short, optical tweezers require a working knowledge of microscopy, optics, and laser techniques. Modern Optical tweezers setup

DEP Trapping

Moving Neutral Particles: Dielectrophoresis

  • N. Manaresi, et al., IEEE Journal of Solid-State Circuits, Vol. 38, Issue 12, pp. 2297 - 2305, 2003.
slide-4
SLIDE 4

4 DEP Trapping

  • N. Manaresi, et al., IEEE Journal of Solid-State Circuits, Vol. 38, Issue 12, pp. 2297 - 2305, 2003.

DEP Trapping

  • N. Manaresi, et al., IEEE Journal of Solid-State Circuits, Vol. 38, Issue 12, pp. 2297 - 2305, 2003.

DEP Trapping

  • N. Manaresi, et al., IEEE Journal of Solid-State Circuits, Vol. 38, Issue 12, pp. 2297 - 2305, 2003.

DEP Trapping

  • N. Manaresi, et al., IEEE Journal of Solid-State Circuits, Vol. 38, Issue 12, pp. 2297 - 2305, 2003.

DEP Trapping - Applications

  • N. Manaresi, et al., IEEE Journal of Solid-State Circuits, Vol. 38, Issue 12, pp. 2297 - 2305, 2003.

Magnetic Trapping

Magnetic bead Bead-bound cell

slide-5
SLIDE 5

5

Cells with engulfed magnetic beads

  • Cell Preparation

Magnetic Trapping

B

Microcoils Cell Magnetic bead

Magnetic Trapping

  • H. Lee, et al. , Applied Physics Letters, Vol. 85, pp. 1063-1065, 2004.

Magnetic field magnitude on the surface

Magnetic Trapping

  • H. Lee, et al. , Applied Physics Letters, Vol. 85, pp. 1063-1065, 2004.

Magnetic Trapping

  • H. Lee, et al. , Applied Physics Letters, Vol. 85, pp. 1063-1065, 2004.
  • H. Lee, et al. , Applied Physics Letters, Vol. 85, pp. 1063-1065, 2004.

Magnetic Trapping

Chip size 1 mm 4 mm Microcoil array Control electronics

Microcoil arrays Control electronics Control electronics

Magnetic Trapping

slide-6
SLIDE 6

6 Magnetic Trapping

Hydrodynamic Trapping

100 μm cylinders: 100 μm diameter microspheres: 20 μm diameter fluid oscillation steady flow

+

steady flow fluid oscillation

  • A. Wheeler, et al., Analytical Chemistry, Vol. 75, pp. 3581-3586, 2003

Structural Trapping Single-Cell Studies

Measurement Procedure

  • 2. Sensing (Biosensing).

Biosensors

SAMPLE

  • Storage
  • Handling
  • Preparation
  • Delivery

BIOTRANSDUCER INFORMATION OUTPUT Interrogate Capture Condition Amplifify Reduce Process Store Data SIGNAL PROCESSING

Some applications for biosensors… Success story: Glucose Monitoring

www.cozmore.com

From a drop of blood Implantable

Biosensors

slide-7
SLIDE 7

7

Classification of Biosensors:

  • Biosensors based on the type of biorecognition layer

used in the biotransducer.

  • Enzyme (glucose oxidase), DNA/RNA (gene), organelle

(mitochondria), whole-cell, tissue slice (liver, heart).

  • Biosensors based on the nature of the solid-state transducer.
  • Optical (light), electrochemical (redox reactions), electronic (I/V

characteristics), gravimetric (mass), pyroelectric (heat), piezoelectric (force-voltage)

  • Biosensors based on the placement.
  • In-vivo, in-vitro, etc.

Biosensors

For example…

  • Biosensors based on the type of biorecognition layer

used in the biotransducer

  • Enzyme (glucose oxidase)
  • Biosensors based on electrochemical (redox reactions)
  • Conductimetric (change in electrical conductivity)
  • Biosensor based on placement
  • In-vitro

An enzyme-conductimetric biosensor for glucose

Biosensors Single-Cell Studies

Measurement Procedure

  • 3. Proteomics.

Automated 2-D electrophoresis

Comprehensive capillary electrophoresis

Power-supply 1 Power-supply 2 Capillary 1 Capillary 2

molecular weight separation micellar electrophoresis separation

MW samples taken at junction for separation in capillary 2

Detector

Capillary 1 Capillary 2

Interface

Automated 2-D electrophoresis

Comprehensive capillary electrophoresis

Automated 2-D electrophoresis

Measurements

slide-8
SLIDE 8

8

Outline

  • Modeling and Simulation

Cell Modeling and Simulation

http://www.nrcam.uchc.edu/

Virtual Cell

  • Developed by the National Resource for Cell Analysis and Modeling

supported by the National Center for Research Resources (NCRR), at the National Institutes of Health (NIH)

http://www.nrcam.uchc.edu/

Virtual Cell

The software is composed of three main components:

  • 1. Modeling Framework
  • 2. Mathematics Framework
  • 3. WWW Interface-Biological Oriented Interface with

Integrated Math Editor Different approaches are used:

  • 1. Ordinary differential equations (ODE),
  • 2. -calculus formal language,
  • 3. Hybrid functional Petri nets (HFPN),

etc.

  • E-CELL is a modeling and simulation environment for

simulation with GUI, based on ODE.

  • Biochemical reactions are represented as a systems
  • f ODEs.
  • For reactions which cannot be represented with

ODEs, it employs ad-hoc user defined C++ programs.

http://www.e-cell.org

E-Cell

http://www.e-cell.org

E-Cell

A model of a hypothetical, minimal cell, based on the gene set of Mycoplasma genitalium, the self-replicating organism having the smallest known genome was constructed. Its gene set was reduced to only those genes that are required for what was defined as a minimal cellular metabolism.

slide-9
SLIDE 9

9

http://www.e-cell.org

E-Cell

  • The E-CELL is a rule-based simulation system, written in

C++.

  • The model consists of three lists, and is loaded at runtime.

1.The substance list defines all objects which make up the cell and the culture medium.

  • 2. The rule list defines all of the reactions which can take

place within the cell.

  • 3. The system list defines functional structure of the cell

and its environment.

  • The state of the cell is expressed as a list of concentration

values of all substances, pH and temperature.

  • In a single time interval, each rule in the rule list is called

upon by the simulator engine to compute the change in concentration of each substance.

Outline

  • Future Technologies…

…The Role of Nanotechnology

Nanodevices Are Small Enough to Enter Cells

Cell White blood cell Water molecule Nanodevices Nanodevices Cancer cell Water molecule Antibodies with proteins Antibodies Bent cantilever Nanodevices Cantilevers White blood cell

Cantilevers Could Make Cancer Tests Faster and More Efficient

A Single- stranded DNA molecule Single-stranded DNA molecule White blood cell Water molecule Nanodevices Nanopores Single-stranded DNA molecule A T C G Nanopore Nanopore Nanopore T

Nanopores

Ultraviolet light off White blood cell Water molecule Nanodevices Quantum dots Quantum dots emit light Ultraviolet light on Quantum dots Quantum dot bead

Quantum Dots

slide-10
SLIDE 10

10

Cancer cells Healthy cells Quantum dot beads Quantum dot beads Healthy cells Cancer cells

Quantum Dots Could Find Cancer Signatures (Diagnosis) Improving Cancer Treatment

Nanotechnology Treatment Traditional Treatment Intact noncancerous cells Noncancerous cells Toxins Nanodevices Cancer cells Dead noncancerous cells Noncancerous cells Drugs Dead cancer cells Dead cancer cells Toxins Cancer cells

Nanoshells

Nanoshell White blood cell Water molecule Nanodevices Nanoshells Gold Near-infrared light on Near-infrared light off Nanoshell absorbs heat

Nanoshells as Cancer Therapy

Nanoshells Dead cancer cells Nanoshells Cancer cells Healthy cells Intact healthy cells Near-infrared light Healthy cells Cancer cells