
SLIDE 1
OTCQB: BLSP Corporate Overview December 2016 0 Safe Harbor - - PowerPoint PPT Presentation
OTCQB: BLSP Corporate Overview December 2016 0 Safe Harbor Statement OTCQB: BLSP This presentation contains forward-looking statements and such statements are subject to risks and uncertainties and may change at any time. You can identify
1
This presentation contains forward-looking statements and such statements are subject to risks and uncertainties and may change at any time. You can identify forward looking statements by terms such as “may”, “will”, “should”, “expect”, “plan”, “project”, “anticipate”, “could”, “intends”, “targets”, “contemplates”, “believes”, “potential”, “continue”, “predict” or negatives of these terms or other similar expressions. These statements are only predictions and involve known and unknown risks, uncertainties and other factors including, without limitation, (i) uncertainties regarding our ability to obtain adequate financing on a timely basis including financing for specific projects, (ii) the financial and operating performance of our projects after commissioning, (iii) uncertainties regarding the market for and value of carbon credits and other environmental attributes, (iv) political and governmental risks associated with the countries in which we
well as delays in obtaining required government permits and approvals, (vi) the development stage of our business, (vii) our lack of
expectations and our actual results and financial condition may differ materially from those indicated in the forward looking statements. Any forward-looking statement made by us in this presentation is based only on information currently available to us and speaks only as of the date on which it is made. Except as required by law we undertake no obligation to publicly update any forward-looking statement, whether written or oral, that may be made from time to time, whether as a result of new information, future developments or
and other reports are available upon request or by going to www.sec.gov.
2
This Confidential Corporate Presentation (this “Corporate Overview”) has been prepared by Blue Sphere Corporation (“Blue Sphere” or the “Company”) solely for informational purposes. Acceptance of this Corporate Presentation by an interested party implies an agreement with the terms herein. This Corporate Overview does not constitute an offer to sell or a solicitation of an offer to buy securities or assets of Blue Sphere. All information presented in this Corporate Overview with respect to the existing business and the historical operating results of Blue Sphere and estimates and projections as to future operations are based on materials prepared by the management of Blue Sphere and involve significant elements of subjective judgment and analysis which may or may not be correct. While the information provided herein is believed to be accurate and reliable, Blue Sphere makes no representations or warranties, expressed or implied, as to the accuracy or completeness of such information. In furnishing this Corporate Overview Blue Sphere reserves the right to amend or replace the Corporate Overview at any time and undertakes no obligation to provide the recipient with access to any additional information. Nothing contained within this Corporate Overview is or should be relied upon as a promise or representation as to the future.
3
4
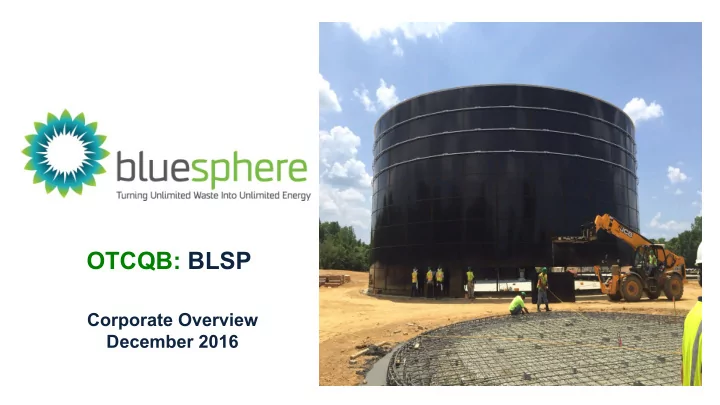
North Carolina
5
Josh Shoham Chairman Shlomi Palas CEO Ran Daniel CFO Roy Amitzur Executive VP Guy Perry VP BD-Europe Beth Clark Logistics Manager
CTO Gidi Amitzur VP Eastern Sphere
Executive VP Rafael Correa
Aviram Lazar Controller
Daniel Schwab VP BD-USA
6
7
8
Source: Waste To Energy (WTE) Market Analysis By Technology (Thermal, Biological) And Segment Forecasts To 2020
9
10
Source: Biogas Opportunities Roadmap Progress Report.
11
12
ü Began Development in June 2012 ü Began Construction in Q4 2014 ü Completed Financial Closing in January 2015 ü Completed Construction of Primary Structures in December 2015 ü Duke Energy Sub-Station Construction in July 2016 ü “White Test” Diagnostics August 2016 ü “Test Waste” in Digesters and Producing Gas September 2016 ü COD & Connected to Grid November 18, 2016 q Mechanical Completion
13
ü Began Development in June 2012 ü Began Construction in Q4 2014 ü Completed Financial Closing in April 2015 ü Completed Construction of Primary Structures in Q1 2016 ü National Grid Sub-Station Construction in June 2016 q “White Test” Diagnostics Q4 2016 q “Test Waste” in Digesters and Producing Gas Q4 2016 q COD & Passing Electricity to Grid Q4 2016 q Mechanical Completion
14
* EBITDA is not generally recognized as a GAAP measurement.
15
16
EPC: Engineering, Procurement and Construction
17
* As reported by AUSTEP
18
* Combined Output
** We have entered into non-binding letters of intent related to these
We can provide no assurances that we will be successful in entering into definitive agreements to either acquire or construct these facilities.
19
** We have entered into non-binding letters of intent related to these
We can provide no assurances that we will be successful in entering into definitive agreements to either acquire or construct these facilities.
20
* AgStar 2010 & K-State Research Above Graphic Content: Common Dreams. September 2016 ***Source: USDA Census of Agriculture
U.S. Environmental Protection Agency (EPA) estimated that AD systems are technically feasible at more than 8,000* U.S. dairy and swine
currently have operational AD systems.
** We have entered into non-binding letters of intent related to these
We can provide no assurances that we will be successful in entering into definitive agreements to either acquire or construct these facilities.
21
(Convert from coal-fired to biomass)
Source: US Energy Information Administration
22
Average Revenue / Per MW $1,500,000 Average Revenue / Per MW $2,180,000 Average EBITDA / Per MW $865,000 Average EBITDA / Per MW $1,024,600
* The numbers reflected above are averages Per MW estimated from projections developed by Blue Sphere in 2016
23
Exchange / Symbol: OTCQB: BLSP 52 Week High / Low: $0.01 - $0.10 Market Cap:* $18,565,723 Total Shares Issued: 262,776,552 Warrants: 63,696,333 $0.091 (Average Exercise Price) Options: 778,761 $0.057 (Average Exercise Price) Total Shares; Fully Diluted: 327,251,646
*As of 11/23/2016
24
25