
SLIDE 1
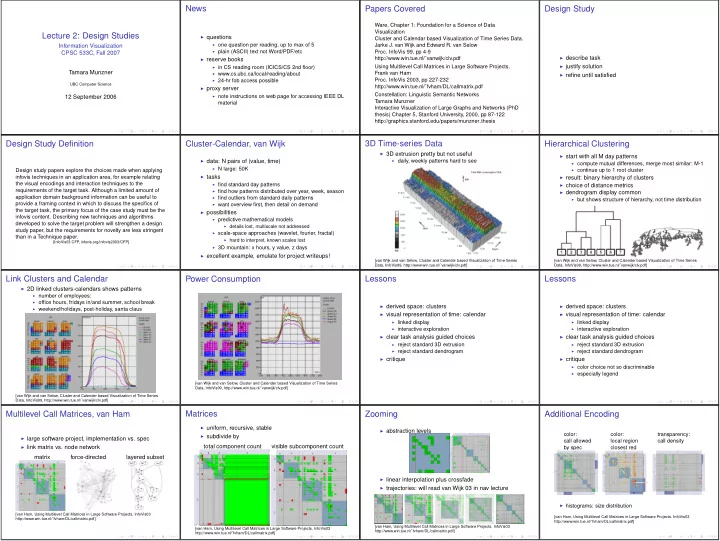
Lecture 2: Design Studies
Information Visualization CPSC 533C, Fall 2007 Tamara Munzner UBC Computer Science 12 September 2006News
◮ questions ◮ one question per reading, up to max of 5 ◮ plain (ASCII) text not Word/PDF/etc ◮ reserve books ◮ in CS reading room (ICICS/CS 2nd floor) ◮ www.cs.ubc.ca/local/reading/about ◮ 24-hr fob access possible ◮ proxy server ◮ note instructions on web page for accessing IEEE DL materialPapers Covered
Ware, Chapter 1: Foundation for a Science of Data Visualization Cluster and Calendar based Visualization of Time Series Data. Jarke J. van Wijk and Edward R. van Selow- Proc. InfoVis 99, pp 4-9
- Proc. InfoVis 2003, pp 227-232
Design Study
◮ describe task ◮ justify solution ◮ refine until satisfiedDesign Study Definition
Design study papers explore the choices made when applying infovis techniques in an application area, for example relating the visual encodings and interaction techniques to the requirements of the target task. Although a limited amount of application domain background information can be useful to provide a framing context in which to discuss the specifics of the target task, the primary focus of the case study must be the infovis content. Describing new techniques and algorithms developed to solve the target problem will strengthen a design study paper, but the requirements for novelty are less stringent than in a Technique paper. [InfoVis03 CFP , infovis.org/infovis2003/CFP]Cluster-Calendar, van Wijk
◮ data: N pairs of (value, time) ◮ N large: 50K ◮ tasks ◮ find standard day patterns ◮ find how patterns distributed over year, week, season ◮ find outliers from standard daily patterns ◮ want overview first, then detail on demand ◮ possibilities ◮ predictive mathematical models ◮ details lost, multiscale not addressed ◮ scale-space approaches (wavelet, fourier, fractal) ◮ hard to interpret, known scales lost ◮ 3D mountain: x hours, y value, z days ◮ excellent example, emulate for project writeups!3D Time-series Data
◮ 3D extrusion pretty but not useful ◮ daily, weekly patterns hard to see [van Wijk and van Selow, Cluster and Calender based Visualization of Time Series Data, InfoVis99, http://www.win.tue.nl/˜vanwijk/clv.pdf]Hierarchical Clustering
◮ start with all M day patterns ◮ compute mutual differences, merge most similar: M-1 ◮ continue up to 1 root cluster ◮ result: binary hierarchy of clusters ◮ choice of distance metrics ◮ dendrogram display common ◮ but shows structure of hierarchy, not time distribution [van Wijk and van Selow, Cluster and Calender based Visualization of Time Series Data, InfoVis99, http://www.win.tue.nl/˜vanwijk/clv.pdf]Link Clusters and Calendar
◮ 2D linked clusters-calendars shows patterns ◮ number of employees: ◮ office hours, fridays in/and summer, school break ◮ weekend/holidays, post-holiday, santa claus [van Wijk and van Selow, Cluster and Calender based Visualization of Time Series Data, InfoVis99, http://www.win.tue.nl/˜vanwijk/clv.pdf]Power Consumption
[van Wijk and van Selow, Cluster and Calender based Visualization of Time Series Data, InfoVis99, http://www.win.tue.nl/˜vanwijk/clv.pdf]Lessons
◮ derived space: clusters ◮ visual representation of time: calendar ◮ linked display ◮ interactive exploration ◮ clear task analysis guided choices ◮ reject standard 3D extrusion ◮ reject standard dendrogram ◮ critiqueLessons
◮ derived space: clusters ◮ visual representation of time: calendar ◮ linked display ◮ interactive exploration ◮ clear task analysis guided choices ◮ reject standard 3D extrusion ◮ reject standard dendrogram ◮ critique ◮ color choice not so discriminable ◮ especially legendMultilevel Call Matrices, van Ham
◮ large software project, implementation vs. spec ◮ link matrix vs. node network matrix force-directed layered subset [van Ham, Using Multilevel Call Matrices in Large Software Projects. InfoVis03 http://www.win.tue.nl/˜fvham/DL/callmatrix.pdf]Matrices
◮ uniform, recursive, stable ◮ subdivide by total component count visible subcomponent count [van Ham, Using Multilevel Call Matrices in Large Software Projects. InfoVis03 http://www.win.tue.nl/˜fvham/DL/callmatrix.pdf]Zooming
◮ abstraction levels ◮ linear interpolation plus crossfade ◮ trajectories: will read van Wijk 03 in nav lecture [van Ham, Using Multilevel Call Matrices in Large Software Projects. InfoVis03 http://www.win.tue.nl/˜fvham/DL/callmatrix.pdf]Additional Encoding
color: call allowed by spec color: local region closest red transparency: call density ◮ histograms: size distribution [van Ham, Using Multilevel Call Matrices in Large Software Projects. InfoVis03 http://www.win.tue.nl/˜fvham/DL/callmatrix.pdf]