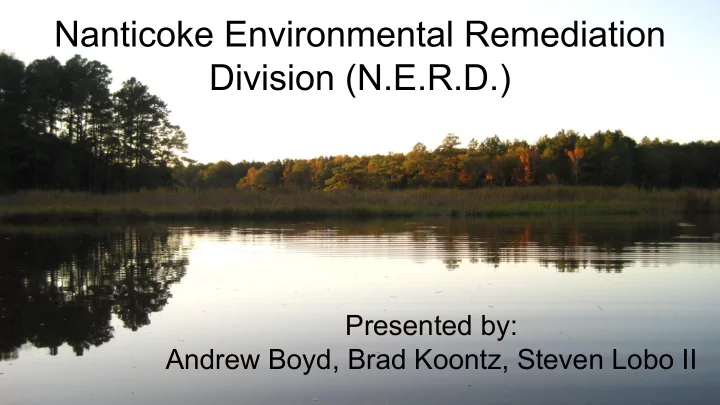

Nanticoke Environmental Remediation Division (N.E.R.D.) Presented by: Andrew Boyd, Brad Koontz, Steven Lobo II
Overview Mission Statement ❏ History and Characteristics ❏ ❏ Population Land Use ❏ Water Use ❏ Environmental Problems ❏ ❏ Existing Organizations Problems and Solutions ❏ Figure 1: Nanticoke River during Winter
Mission Statement ❏ The Nanticoke River is a historically “dirty” river but, conditions are improving. ❏ This watershed is home to more than 250 endangered plant and animal species as well as containing the most significant wetlands of the Delmarva peninsula. ❏ Nitrogen and phosphorous are causing algal blooms. Also, the sandy soil is allowing groundwater pollution to travel faster. ❏ We seek to reduce nitrogen and phosphorus levels by 50% in the next 20 years, as well as reduce groundwater pollution transport by 25%. Figure 2: Nanticoke River during Summer
History - Natives & Settlers ❏ 10th C: evidence of fishing, farming, and hunting by Nanticoke Indians ❏ Early 17th C: estimate of 1,000 acres of agriculture in watershed when Captain John Smith explored Mid 17th C: Nanticoke Indians have been ❏ removed to three reservations 1660’s: land patents are first filed by settlers- ❏ primarily for use as tobacco fields Sharptown, Vienna, and Bethel become ❏ shipbuilding hubs and remained so until the early 20th C saw the forests cleared ❏ British attacked Vienna during the War of 1812 because it was considered a major port Figure 3: Outline of Nanticoke Watershed with Nearby Watersheds
GIS Applications 1 This map displays the Nanticoke DEM after the Fill This map displays the Naticoke DEM after the This map displays the sub-basin areas that drain tool has been run on it. Flow Direction tool has been run on it. to each of the targeted stream links. Figure 4: DEM Fill Figure 5: Flow Direction Figure 6: Sub-basin Drainage
Watershed Characteristics ❏ Area: 725,000 acres or 1,130 square miles Length: 88.5 miles ❏ Channel Depth: Dredged to 12 ft to Seaford, DE ❏ ❏ Maximum Elevation: 19.8 ft ❏ Features generally very flat terrain Span: 2 States and 5 Counties (Kent & Sussex ❏ in DE; Caroline, Dorchester & Wicomico in MD) Figure 7: Nanticoke River Watershed is shaded in green
Population Population: 42353 Source: U.S. Census Major Cities Seaford, DE (2013)- 7,325 Laurel, DE (2013)- 3,912 Figure 8: Population Density Map of Delaware and Maryland, Nanticoke River Watershed is roughly captured in the black boxes, Laurel and Seaford are marked with black crosses
Land Use ❏ Approximately 20% of Watershed is protected ❏ Blackwater Wildlife Refuge: 27,000 acres ❏ State and Local Parks: 32,000 acres Primarily agricultural with large ❏ forested areas near the bay and along waterways. ❏ Heavily residential and commercial near port cities such as Seaford and Federalsburg. Major decline in wetlands from ❏ approximately 50% historically to just over 20% by 1998. Figure 9: Land Use Map of Nanticoke River Watershed
Water Use With the exception of blue crabs, ❏ commercial fishing has been reduced due to poor stream health. Overfishing of oysters in the ❏ past has all but eliminated them. Recreational fishing remains very ❏ popular. It is free of dams which supports the ❏ remaining fisheries. Popular for boating and supports a ❏ number of marinas and yacht clubs. Figure 10: Aerial View of the Nanticoke River and Surrounding Areas
Environmental Problems Sea-level Rise Will Redraw Maps Figure 11 (Top Left): Graph depicting sea level rise over 100 years in Baltimore, MD. Figure 12 (Bottom Left): Graph showing average water temperature increase in the Chesapeake Bay. Figure 13 (Above): Graph showing low-lying areas around mouth of the Nanticoke River.
GIS Applications 2 This map displays agricultural areas extracted This map displays the integer output map showing This map displays a better indication of the from the Landuse raster. flow accumulations from agricultural cells only. vulnerability of streams to agricultural runoff. Figure 14: Agricultural Raster Figure 15: Integer Flow Accumulation Figure 16: Runoff Vulnerability
GIS Applications 3 This image displays the normalized difference Runoff abatement map based on vegetation Slope map from raster calculation vegetation index map of the watershed. density weights. Figure 18: Vegetation Index Figure 19: Runoff Abatement Figure 20: Slope Raster Calculation
Impervious Land The total residential and urban developed land is about 2 percent of the watershed (CBF 1996). The watershed had 0.8 percent impervious surface cover in 1995. Figure 17: Impervious cover in the Chesapeake Bay area
Problems and Solutions Table 1: Problem, Effect and Solution table Problem Effect Solution Excess nutrients (Nitrogen Algal blooms that result in Agricultural programs or & Phosphorus) from poultry decreasing dissolved legislation to minimize and crop farms oxygen runoff into the river Sandy soil conditions in the Nitrates in groundwater flow Regular emptying and watershed lead to in Nanticoke River maintenance of septic groundwater pollution systems negatively impacting the river
Existing Programs and Organizations Envirocorp Labs ❏ Delaware Department of Natural Resources and Environmental Control ❏ J ohns Hopkins University ❏ Chesapeake Bay Foundation ❏ National Park Service ❏ MD Department of Natural Resources ❏ Salisbury University ❏ Friends of the Nanticoke River ❏ Wicomico Environmental Trust ❏ Nanticoke Watershed Preservation Committee ❏ Nanticoke Resource Coalition ❏ The Nature Conservancy, Salisbury, MD Office ❏ Nanticoke River Conservation Directory ❏
Sources http://delawarewatersheds.org/chesapeake-bay/nanticoke-river/ ftp://131.252.97.79/Transfer/WetlandsES/Articles/weller_wetland_landscapeindicators.pdf http://nanticokeriver.org/programs/atlas/ https://upload.wikimedia.org/wikipedia/commons/f/f5/Maryland_population_map.png http://ldecola.net/edu/jhu/sp09/final/kbarrett.jpg http://www.arcgis.com/home/webmap/viewer.html?basemapUrl=http://tiles.arcgis. com/tiles/I6k5a3a8EwvGOEs3/arcgis/rest/services/MyMapService/MapServer http://www.dnrec.delaware.gov/Admin/DelawareWetlands/Documents/Nanticoke%20Wetland%20Profile_final.pdf http://imblackeagle.tripod.com/index-8.html
Recommend
More recommend