Merced Water Resources Model (MercedWRM) Application to GSP - - PowerPoint PPT Presentation

merced water resources model mercedwrm application to gsp
SMART_READER_LITE
LIVE PREVIEW

Merced Water Resources Model (MercedWRM) Application to GSP - - PowerPoint PPT Presentation

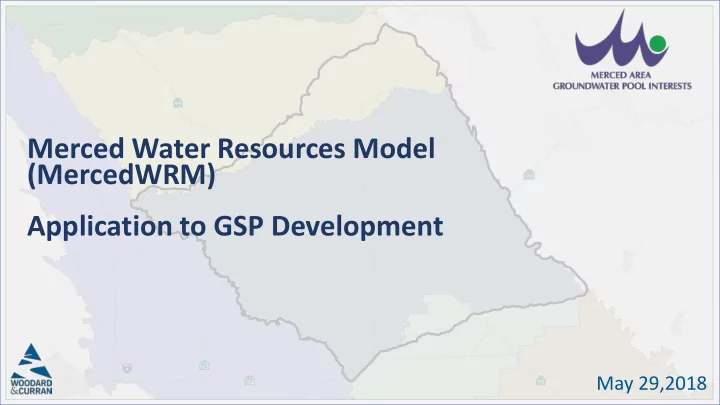
Merced Water Resources Model (MercedWRM) Application to GSP Development May 29,2018 Meeting Agenda Introductions Review of Model Input Data Review of Model Calibration Review of Model Baseline Discussion on Model Applications


slide-1
SLIDE 1

Merced Water Resources Model (MercedWRM) Application to GSP Development

May 29,2018

slide-2
SLIDE 2

Meeting Agenda

  • Introductions
  • Review of Model Input Data
  • Review of Model Calibration
  • Review of Model Baseline
  • Discussion on Model Applications
slide-3
SLIDE 3

Model Area

Intended Uses

  • Basin Characteristics
  • Natural Conditions
  • Stream-Aquifer Interaction
  • Land Subsidence
  • Water Quality
  • SGMA Support
  • Groundwater Banking
  • Groundwater Sustainability
  • Water Availability
  • Project Beneficiary

Assessment

slide-4
SLIDE 4

Model Objectives

Basin Characteristics

Historical, Current and Projected Levels of Development Natural Conditions Land Subsidence Stream-Aquifer Interaction Water Quality Conjunctive Management Reservoir Operations Water-Energy

slide-5
SLIDE 5

Model Objectives

Project Evaluations

SGMA, IRWM, GWMP Groundwater Banking Water Availability Groundwater Sustainability Urban Water Supply Storm water and Recycled Water Opportunities Hydro-Economic Evaluations Project Beneficiary Assessment

slide-6
SLIDE 6

Data Collection and Analysis Input Data Preparation for IWFM 4.0 Preparation of IDC 4.0 Preliminary Calibration of IDC to METRIC Conversion to IWFM & IDC 2015 Collection & Analysis of Additional Data on MID SW Deliveries Re-Calibration

  • fAg Demand

Estimation to METRIC Verification with MID’s Water Balance Model & Adjust IDC as Needed Calibration: Water Budgets GWHeads Distribution GWLevels Trends Calibration: Streamflow Stream- Aquifer Interaction Summarize Calibration Results and Statistics Prepare Documentation Present Results to the TWG and MAGPI

Model Development; A Multi-Year Process

slide-7
SLIDE 7

Model Developed in Open and Transparent Environment

  • Development period: 2010 to ~2017
  • Originally developed within MAGPI framework
  • Model development primary partners:
  • Merced Irrigation District
  • City of Merced
  • Merced County
  • Department of Water Resources
  • Other Collaborators: MAGPI Members
  • Technical Advisory Committee: DWR, USGS, UC Merced
slide-8
SLIDE 8

Integrated Hydrologic Processes

  • Land Surface Processes
  • Groundwater Flow
  • Streamflow
  • Physical Systems Integration
  • Water Budgets
slide-9
SLIDE 9

Model Grid Features

Grid Criteria

  • Bulletin 118 (2003)

Groundwater Basin Boundaries

  • Agency Boundaries
  • Operational Boundaries
  • Stream Flow Lines
  • Major Conveyance

Features

  • Unincorporated Land Use
  • Topography/Drainage
  • 5-Mile Boundary Buffer
slide-10
SLIDE 10

Merced WR Model and GSA Boundaries

Grid Statistics

  • 607,000 Total Acres
  • 71 Stream Reaches
  • 37 Subregions
  • 17,696 Nodes
  • Stream Lines
  • Agency Boundaries
  • ¼ Mile Discretization
  • 19,563 Elements
  • Average Size = 24 Acres
slide-11
SLIDE 11

Stream Network

Simulated Streams

  • 71 Stream Reaches
  • 1548 Stream Nodes
  • Gauged Stream Inflow

MID Canal Network

  • Over 200 canals

accounted for in grid

  • Canal recharge based on

canal size and lining

slide-12
SLIDE 12

Stream Network

slide-13
SLIDE 13

Geology / Hydrogeology

Source Data

  • USGS
  • Page & Balding 1973
  • Page 1977
  • Digital Elevation Model
  • Corcoran Clay Depth
  • Corcoran Clay Thickness
  • USGS Texture Model
  • C2VSim-2015
  • Base of Fresh Water
  • Continental Deposit
slide-14
SLIDE 14

Model Stratigraphic Layering

slide-15
SLIDE 15

Merced WR Model Hydrology

Rain Gauges

  • 3 local rain stations
  • Daily data from 1967

PRISM

  • 4 kilometer

discretization

  • 26,318 in California
  • 620 in the MercedWRM
  • Daily Data from 1921
  • 25
  • 20
  • 15
  • 10
  • 5

5 10 15 20 25 30 35 5 10 15 20 25 30 1970 1975 1980 1985 1990 1995 2000 2005 2010 2015 Cumulative Departure (in) Precipitation (in) Water Year Precipitation (in) Long Term Average Cumulative Departure

Calibration Period

slide-16
SLIDE 16

Merced WR Model Hydrology

Rainfall Distribution Based on PRISM Model

(Oregon State University: Parameter- elevation Relationships on Independent Slopes Model)

slide-17
SLIDE 17

Water Demand Estimation (IDC)

  • Urban Water Demand
  • Basis: Population, Per capita water use, water sales estimates/measurements,

indoor/Outdoor ratios

  • Sources of data: UWMPs, Census
  • Agricultural Water Demand
  • Basis: Land use, Crop acreage, ET estimates, precipitation
  • Sources of data: DWR land use surveys, Ag Commissioner Data, CropScape,

ITRC METRIC, MID data, MID-WBM (Water Balance Model)

slide-18
SLIDE 18

Estimation of Urban Water Demand

Urban Components

  • Population
  • Per-Capita Water Use

Available Data

  • Census Data
  • Municipal Groundwater

Production Records

10 20 30 40 50 60 70 80 90 100 1995 1996 1997 1998 1999 2000 2001 2002 2003 2004 2005 2006 2007 2008 2009 2010 2011 2012 2013 2014 2015 Urban Water Demand (TAF) Water Year Merced Atwater Livingston Rural

*Hatched fill indicates estimated values

slide-19
SLIDE 19

Estimation of Agricultural Water Demand

slide-20
SLIDE 20

Estimation of Agricultural Water Demand

Model Calibration Comprehensive ET Estimation

IWFM Demand Calculator METRIC Data Soil Data Land Use Data Base ETc

slide-21
SLIDE 21

Land Use

Available Data

  • DWR Land Use Surveys
  • 1995, 2002, 2012
  • USDA NASS CropScape
  • 2007 – 2015
  • Other Data Sources
  • MID Annual Reports
  • Merced County Ag

Commissioner Reports

slide-22
SLIDE 22

Land Use – MAGPI Area

slide-23
SLIDE 23

Soil Parameters

SURGO

  • Elemental Discretization
  • Soil Hydrologic Group
  • Input Parameters
  • Hydraulic Conductivity
  • Pour Size Distribution

Index

  • Total Porosity
  • Field Capacity
  • Wilting Point
slide-24
SLIDE 24

Soil Parameters

Reference Evapotranspiration

  • Valiance in data gives
  • ffers range for model

calibration. Data Sources

  • C2VSimFG
  • CIMIS
  • ITRC

10 20 30 40 50 60 70 Pasture Alfalfa Field Crops Truck Crops Tomato Orchards Grains Vineyards Cotton Citrus & Subtropical Rice Native Vegetation Riparian Vegetation

Annual Crop Evapotranspiration (in) DWR Land Use Class

Range of ETc within DWR Land Use Classes

ITRC ETc C2VSim ETc

slide-25
SLIDE 25

Estimation of Agricultural Water Demand

ITRC-METRIC Model Computations LandSAT Image

slide-26
SLIDE 26

Estimation of Agricultural Water Demand

METRIC Process

  • Base Data
  • 30 Meter Grid
  • Available Monthly
  • Processed Data
  • Subregional Aggregation
  • Used as calibration tool

for IWFM Demand Calculator

slide-27
SLIDE 27

Estimation of Agricultural Water Demand

METRIC Process

  • Base Data
  • 30 Meter Grid
  • Available Monthly
  • Processed Data
  • Subregional Aggregation
  • Used as calibration tool

for IWFM Demand Calculator

slide-28
SLIDE 28

Estimation of Agricultural Water Demand- MAGPI Area

slide-29
SLIDE 29

Model Calibration: Groundwater Levels

slide-30
SLIDE 30

Model Calibration: Groundwater Levels

slide-31
SLIDE 31

Model Calibration: Statistics

slide-32
SLIDE 32

Model Calibration: Statistics

0% 5% 10% 15% 20% 25% 30% 35% 40% 100 200 300 400 500 600 700 800 900 1000

  • 50 - -40
  • 40 - -30
  • 30 - -20
  • 20 - -10
  • 10 - 0

0 - 10 10 - 20 20 - 30 30 - 40 40 - 50

Percent of Total Observed Data Number of Events Range of Divergence (ft)

+60% within 10 feet +90% within 20 feet

slide-33
SLIDE 33

Merced Water Quality Model

Water Quality Framework

  • A quasi 3-D solute transport

model that simulates the advective-dispersive movement

  • f conservative substances in

the groundwater system

slide-34
SLIDE 34

Model Assumptions

  • Boundary Conditions
  • North: 196 mg/L
  • West: 1,500 mg/L
  • South: 209 mg/L
  • Surface Loading
  • Ag: 1,000 lbs/acre
  • Urban: 500 lbs/acre
  • Stream Quality
  • Rivers: 35 mg/L
  • Canals: 50 mg/L

Merced Water Quality Model: TDS

slide-35
SLIDE 35

Merced Water Quality Model: Nitrate as N

Model Assumptions

  • Boundary Conditions
  • North: 6.84 mg/L
  • West: 1.14 mg/L
  • South: 0.70 mg/L
  • Surface Loading
  • Ag: 1,000 lbs/acre
  • Urban: 500 lbs/acre

Stream Quality

  • Rivers: 3.5 mg/L
  • Canals: 5.0 mg/L
slide-36
SLIDE 36

WQ Model: Sample TDS Chemo-graphs

slide-37
SLIDE 37

WQ Model: Sample Nitrate Chemo-graphs

slide-38
SLIDE 38

Model Applications Accepted Model

System Behavior

System Response Alternatives Formulation

Short-Term Operations

Operations Analysis Testing & Monitoring Adaptive Management

Long-Term Planning

Baseline Alternatives Analysis

slide-39
SLIDE 39

Model Area

Water Budget Areas

  • MercedWRM Boundary
  • Merced Subbasin
  • MIUGSA
  • Merced Subbasin GSA
  • Turner Island WD GSA-1
slide-40
SLIDE 40

GSA Water Budgets

slide-41
SLIDE 41

Historical Total Water Budget (WY 1995-2015)

Merced Groundwater Subbasin

72,000 5,000 65,000 17,000 500,000 29,000 141,000 282,000 79,000 91,000 Private Ag. Pumping MID Pumping

  • Ag. Runoff &

Return Flow Ag. Percolation Urban Pumping Urban Runoff & Return Flow Urban Percolation Undeveloped Runoff & Return Flow 41,000 18,000 195,000 135,000 116,000 Undeveloped Percolation Stream Recharge Canal Recharge 500,000 319,000 257,000 645,000 79,000 37,000 Precipitation

  • n Urban Land

Urban Land ET Undeveloped Area Stream Inflow

  • Precip. on

Undeveloped Land Undeveloped Land ET Private Ag. Pumping Surface Water Deliveries Precipitation

  • n Ag. Land
  • Ag. Land ET

Urban Pumping

Agricultural Undeveloped Urban Groundwater

Ag Other: 8000 Average Change in Storage: -119000 Undeveloped Other: -4000 Urban Other:

  • 2000

Other Subsurface Flows: 6000 Boundary Inflow: -28000 Agricultural Area: 279000 acres Urban Area: 40000 acres Undeveloped Area: 198000 acres

slide-42
SLIDE 42

Historical Land & Water Use Budget (WY 1995-2015)

Merced Groundwater Subbasin

slide-43
SLIDE 43

Historical Groundwater Budget (WY 1995-2015)

Merced Groundwater Subbasin

slide-44
SLIDE 44

Historical Groundwater Budget (WY 1995-2015)

Merced Groundwater Subbasin

slide-45
SLIDE 45

Current Conditions Baseline - Assumptions

  • Hydrologic Period: Water Years 1970-2015 (~46 Hydrology)
  • Merced River Flow: MercedSIM
  • Other Tributaries:
  • Historical record when available
  • Water year index for missing data
  • 2013 Land Use and Cropping Patterns
  • 2013 Urban Water Use
  • Main Canal Diversions: MercedSIM
  • MID Deliveries:
  • 1995-2013
  • Historical deliveries adjusted by MercedSIM Main Canal diversions
  • 1970-1994 & 2014-2015
  • Monthly delivery estimated based on WYI for 1995-2013
  • Local Water Purveyor Operations: Monthly average by water year index
slide-46
SLIDE 46

Merced WR Model Baseline Hydrology

  • 25
  • 20
  • 15
  • 10
  • 5

5 10 15 20 25 30 35 5 10 15 20 25 30 1970 1975 1980 1985 1990 1995 2000 2005 2010 2015 Cumulative Departure (in) Precipitation (in) Water Year Precipitation (in) Long Term Average Cumulative Departure

slide-47
SLIDE 47

Current Condition Baseline Land & Water Use Budget

Merced Groundwater Subbasin

slide-48
SLIDE 48

Current Condition Baseline Groundwater Budget

Merced Groundwater Subbasin

slide-49
SLIDE 49

Current Condition Baseline Groundwater Budget

Merced Groundwater Subbasin

slide-50
SLIDE 50

Future Conditions Baseline

  • Hydrologic Period: Water Years 1970-2015 (~46 Hydrology)
  • Merced River Flow: MercedSIM
  • Other Tributaries:
  • Historical record when available
  • Water year index for missing data
  • 2040 Land Use and Cropping Patterns
  • Urban Water Use: Buildout Conditions
  • Main Canal Diversions: MercedSIM
  • MID Deliveries: Projected Conditions based on MercedSIM Estimates
slide-51
SLIDE 51

Questions …