
SLIDE 1
MDS Embedding
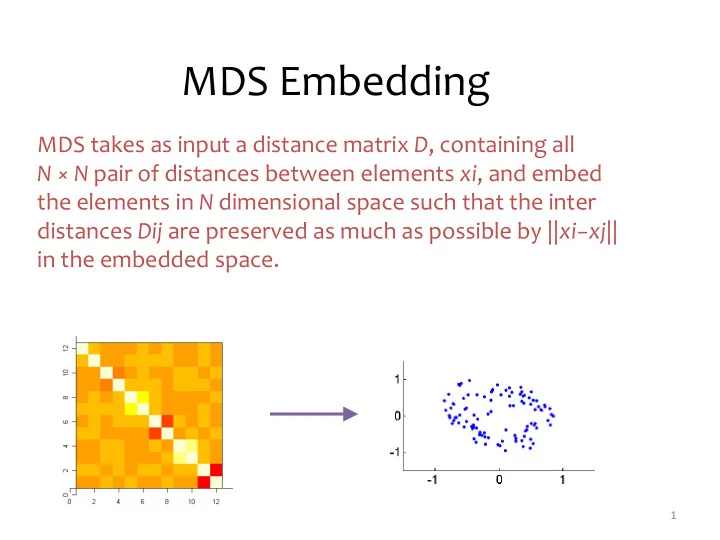
MDS takes as input a distance matrix D, containing all N × N pair of distances between elements xi, and embed the elements in N dimensional space such that the inter distances Dij are preserved as much as possible by ||xi−xj|| in the embedded space.
1