
SLIDE 1
Two Big Ideas for Teaching Big Data May 20, 2014 www.StatLit.org/pdf/2014-Schield-ECOTS-Slides.pdf 1
2014 Schield eCOTS
TWO BIG IDEAS FOR TEACHING BIG DATA Coincidence & Confounding by Milo Schield
Augsburg College, USA Electronic Conference on Teaching Statistics (E-COTS)
May 20, 2014.
www.StatLit.org/pdf/2014-Schield-eCOTS-Slides.pdf
1
2014 Schield eCOTS
2
Start up
How many participants are online? __________ Q1: When teaching introductory statistics, who chooses your text? ___ Teacher ____ Teachers together ___ Others
- Q2. What fraction of a one-semester introductory statistics
course should focus on coincidence and confounding? ____ 0 - 5%; _____ 5 -15%; _____ 15 - 30% ____ 30 - 50% _____ At least half
3
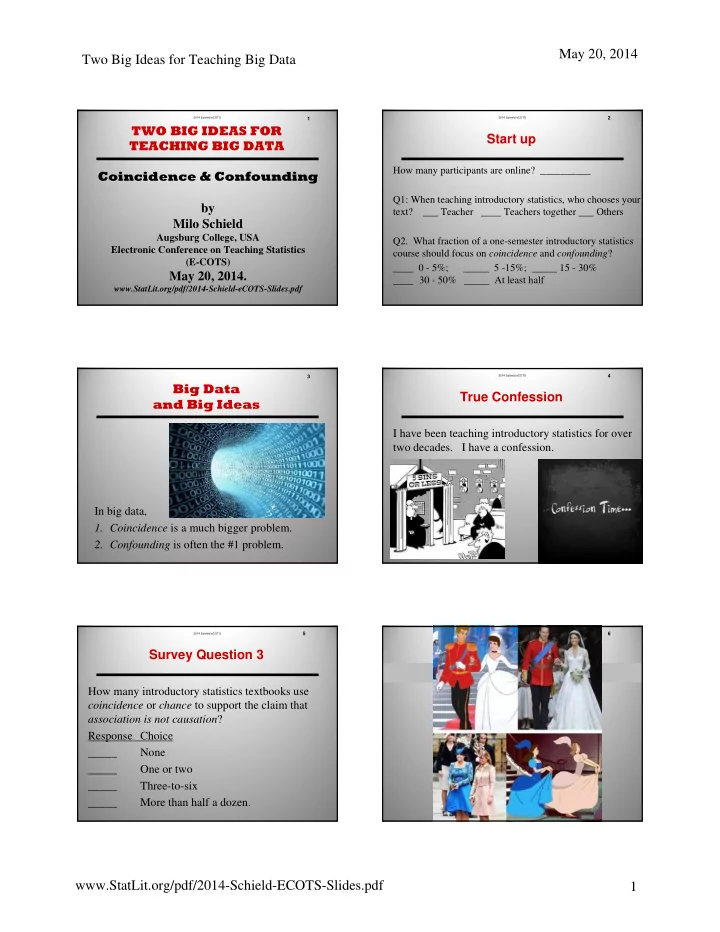
Big Data and Big Ideas
In big data,
- 1. Coincidence is a much bigger problem.
- 2. Confounding is often the #1 problem.
2014 Schield eCOTS
4
True Confession
I have been teaching introductory statistics for over two decades. I have a confession.
2014 Schield eCOTS
5
Survey Question 3
How many introductory statistics textbooks use coincidence or chance to support the claim that association is not causation? Response Choice _____ None _____ One or two _____ Three-to-six _____ More than half a dozen.
2014 Schield eCOTS
6