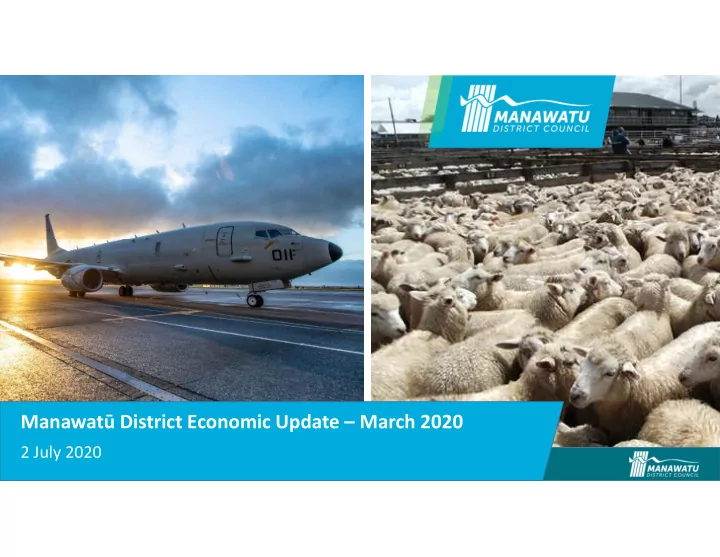

Manawatū District Economic Update – March 2020 2 July 2020
Key messages • The Manawatū District economy continued to grow strongly to the year ended March 2020. • Inevitably, level 3 and level 4 restrictions significantly affected economic activity. • The industry mix of the District presents some resilience to the worst impacts of COVID-19. • The continuation of strong global demand for goods produced in the District boosts resilience as does strong central government activity and employment. • Other indicators reflect the inevitable impacts of COVID-19. • Industry vulnerabilities continue as do the impacts of uncertainty on household and business economic activity. Drought remains a risk to our crucial primary sector. • Providing business support and information will support business and household activity.
Strong GDP growth across much of the region continued to March
Export values continue to increase year on year Year ended March 2020 vs year ended March 2019 Year ended May 2020 vs year ended May 2019
New Zealand export trade continues to hold up well
The value of dairy and meat exports now exceeds 2019
Jobseekers ↑ 112 to 759 over the year to March 2020
Jobseeker beneficiaries ↑ 160 to 919 from March to May
Regional jobseeker benefits ↑ 46 over the week to 19 June
Trade Me job ads recover from lockdown lows
Strong demand for new dwellings continue
Building consent values remain strong by historical standards
Strong house price growth continues across the Region
Local retail spending falls 41.6% in April vs 54.6% fall across NZ
Retail spending picks up post lockdown
Tourism spending for the year ended April 2019 falls as expected • Ruapehu District ↓ 11.1% • Whanganui District ↓ 6.4% • Rangitikei District ↓ 5.6% • Manawatū District ↓ 6.0% • Palmerston North City ↓ 5.2% • Tararua District ↓ 10.5% • Horowhenua ↓ 10.7% • Manawatū-Whanganui Region ↓ 7.4% • New Zealand ↓ 6.9%
Tourism spending for the year ended April 2019 falls as expected April-2020 April-2020 Percent change in Percent change in April-2020 RTO Domestic International total spend from total spend from Total spend spend spend April-2019 Year to April-2019 Auckland Tourism, Events and Economic Development (ATEED) $40m $30m $69m -89% -5% Central Economic Development Agency (CEDA) $3m $1m $4m -91% -8% Destination Fiordland $0m $0m $0m -99% -20% Destination Great Lake Taupo $3m $0m $3m -95% -8% Destination Kaikoura $0m $0m $0m -96% -11% Destination Marlborough $2m $1m $2m -94% -8% Destination Queenstown $2m $2m $4m -98% -10% Destination Rotorua $3m $1m $3m -96% -12% Destination Wairarapa $2m $2m $4m -77% 0% Lake Wanaka Tourism $2m $2m $4m -92% -8% Mackenzie Region $1m $0m $1m -98% -12% Nelson Regional Development Agency (NRDA) $3m $1m $4m -93% -11% Visit Ruapehu $2m $0m $2m -85% -12% Visit Whanganui $1m $0m $2m -87% -7% Wellington Regional Economic Development Agency (WREDA) $17m $7m $25m -88% -8%
GDP expected to contract by 3.5% over 2020 due to lockdown vs 3.7% for NZ
Vulnerabilities continue in service industries with continued pressure on key sectors - Services sector businesses and employment are most vulnerable to the impacts of COVID-19 however data post lockdown is looking positive. - Construction sector has some vulnerability but the strong pipeline of work will support the sector. Protecting capacity is vital to the economic recovery. - Global and domestic food demand is supporting our rural sector. Some vulnerabilities persist due to the impacts of drought and global economic volatility. - The manufacturing sector remains vulnerable to global demand conditions and supply side disruptions. Data indicates agri-food manufacturing is holding up.
On the bright side… • The Manawatū District economy started from a position of strength. • Strength in agri-food production and government employment and limited exposure to international tourism adds to our resilience. • Global demand conditions remain supportive of local economic activity. • Indicators show partial recovery of business and consumer spending and business and consumer confidence. House prices and levels of private planned investment remain strong. • Fiscal stimulus and high levels of planned government investment will drive household and business confidence and support levels of employment (as long as tangible progress is made and soon).
Reducing uncertainty crucial to support economic recovery
Available resources • Pride in our economy - https://pride-in-our-economy-manawatudc.hub.arcgis.com/ • CEDA – business support - https://ceda.nz/covid-19-business-support/ • CEDA economic dashboard - https://ceda.nz/covid-19-business-support/covid-19- impact-dashboard/ • Feilding & District Promotions - http://www.f/co.nz/ • Manawatū-Whanganui Regional Indicators – https://www.mwri.co.nz • StatsNZ and RBNZ dashboards - https://t.co/OKBDEcRaJ0 and https://www.stats.govt.nz/experimental/covid-19-data-portal
The outlook for forestry is improving
Recommend
More recommend