
SLIDE 1
Managerial Finance 2 Page | 150150150
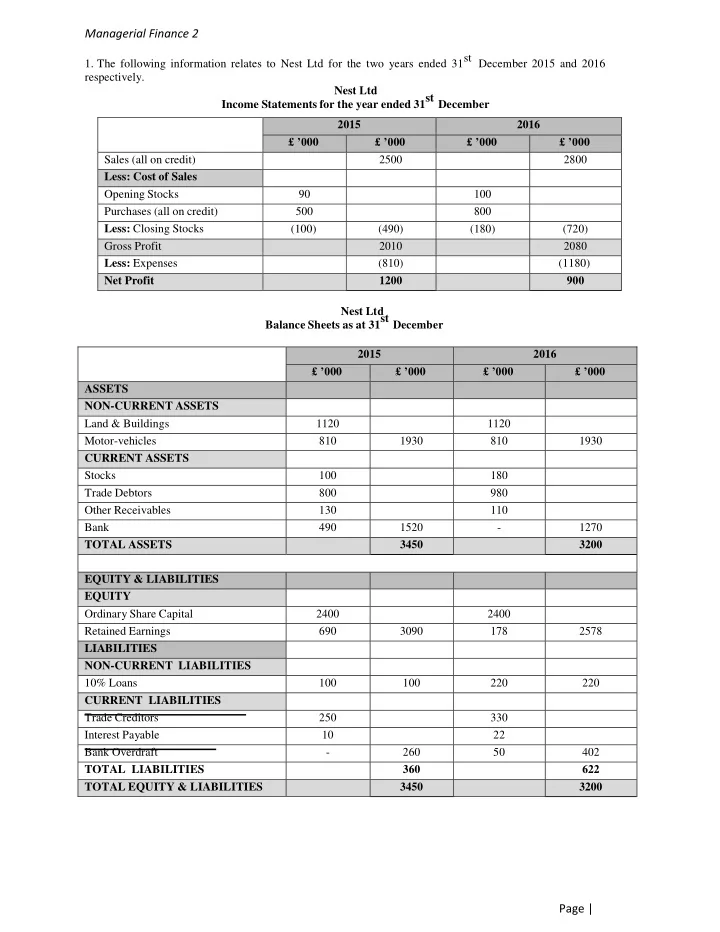
- 1. The following information relates to Nest Ltd for the two years ended 31st December 2015 and 2016
respectively. Nest Ltd Income Statements for the year ended 31st December 2015 2016 £ ’000 £ ’000 £ ’000 £ ’000 Sales (all on credit) 2500 2800 Less: Cost of Sales Opening Stocks 90 100 Purchases (all on credit) 500 800 Less: Closing Stocks (100) (490) (180) (720) Gross Profit 2010 2080 Less: Expenses (810) (1180) Net Profit 1200 900 Nest Ltd Balance Sheets as at 31st December 2015 2016 £ ’000 £ ’000 £ ’000 £ ’000 ASSETS NON-CURRENT ASSETS Land & Buildings 1120 1120 Motor-vehicles 810 1930 810 1930 CURRENT ASSETS Stocks 100 180 Trade Debtors 800 980 Other Receivables 130 110 Bank 490 1520
- 1270
TOTAL ASSETS 3450 3200 EQUITY & LIABILITIES EQUITY Ordinary Share Capital 2400 2400 Retained Earnings 690 3090 178 2578 LIABILITIES NON-CURRENT LIABILITIES 10% Loans 100 100 220 220 CURRENT LIABILITIES Trade Creditors 250 330 Interest Payable 10 22 Bank Overdraft
- 260