
SLIDE 1
1 1
Making AQM Work: Making AQM Work: An Efficient Alternative to ECN An Efficient Alternative to ECN
Long Le, Jay Aikat, Kevin Jeffay, and Don Smith Long Le, Jay Aikat, Kevin Jeffay, and Don Smith The The UNIVERSITY UNIVERSITY of
- f NORTH CAROLINA
NORTH CAROLINA at at CHAPEL HILL CHAPEL HILL
http://www.cs.unc.edu/Research/dirt
October October 2003 2003
2 2
Making AQM Work Making AQM Work
Outline Outline
- Background: Router-based congestion control
Background: Router-based congestion control
– – Active Queue Management Active Queue Management – – Explicit Congestion Notification Explicit Congestion Notification
- State of the art in active queue management (AQM)
State of the art in active queue management (AQM)
– – Control theoretic Control theoretic v
- v. traditional randomized dropping AQM
. traditional randomized dropping AQM
- Do AQM schemes work?
Do AQM schemes work?
– – An empirical study of the effect of AQM on web performance An empirical study of the effect of AQM on web performance
- Analysis of AQM performance
Analysis of AQM performance
– – The case for The case for differential congestion notification differential congestion notification (DCN) (DCN)
- A DCN prototype and its empirical evaluation
A DCN prototype and its empirical evaluation
3 3
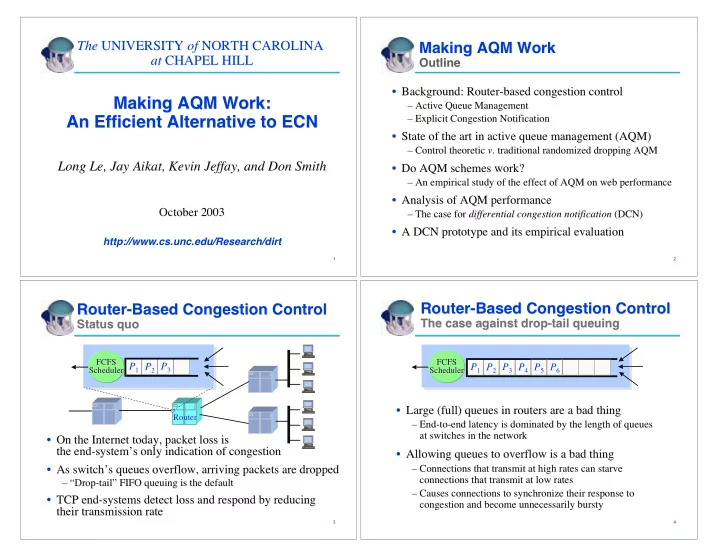
Router-Based Congestion Control Router-Based Congestion Control
Status quo Status quo
- On the Internet today, packet loss is
On the Internet today, packet loss is the end-system the end-system’ ’s only indication of congestion s only indication of congestion
- As switch
As switch’ ’s queues overflow, arriving packets are dropped s queues overflow, arriving packets are dropped
– – “ “Drop-tail Drop-tail” ” FIFO queuing is the default FIFO queuing is the default
- TCP end-systems detect loss and respond by reducing
TCP end-systems detect loss and respond by reducing their transmission rate their transmission rate
P1 P2 P3
FCFS FCFS Scheduler Scheduler Router Router
4 4
Router-Based Congestion Control Router-Based Congestion Control
The case against drop-tail queuing The case against drop-tail queuing
- Large (full) queues in routers are a bad thing
Large (full) queues in routers are a bad thing
– – End-to-end latency is dominated by the length of queues End-to-end latency is dominated by the length of queues at switches in the network at switches in the network
- Allowing queues to overflow is a bad thing
Allowing queues to overflow is a bad thing
– – Connections that transmit at high rates can starve Connections that transmit at high rates can starve connections that transmit at low rates connections that transmit at low rates – – Causes connections to synchronize their response to Causes connections to synchronize their response to congestion and become unnecessarily congestion and become unnecessarily bursty bursty P1 P2 P3 P4 P5 P6
FCFS FCFS Scheduler Scheduler