Macro drivers and priorities ! Rapid economic growth has ! - - PDF document

macro drivers and priorities
SMART_READER_LITE
LIVE PREVIEW

Macro drivers and priorities ! Rapid economic growth has ! - - PDF document

Regional Workshop on Beef markets and trade in China and Southeast Asia China country profile Wang Jimin, Zhang Huijie, Dong Xiaoxia, Wang Mingli (Chinese Academy of Agricultural Sciences) Scott Waldron (the University of Queensland) Helvetas


slide-1
SLIDE 1

Helvetas Vietnam

Regional Workshop on Beef markets and trade in China and Southeast Asia China country profile

Wang Jimin, Zhang Huijie, Dong Xiaoxia, Wang Mingli (Chinese Academy of Agricultural Sciences) Scott Waldron (the University of Queensland)

Macro drivers and priorities

! Rapid economic growth has

! Increased rural incomes – reduced incentives for small-holders to raise cattle ! and urban incomes – increased consumption

! Government priorities

! Concern with food price inflation, food safety and “modernization”

! Agribusiness activity

! (Over) investment in agro-industry (feedlots, modern abattoirs, retail, often integrated)

! Socio-economic importance

! Cattle production is significant but becoming less important in the rural economy ! But beef important in diet for some ethnic minorities

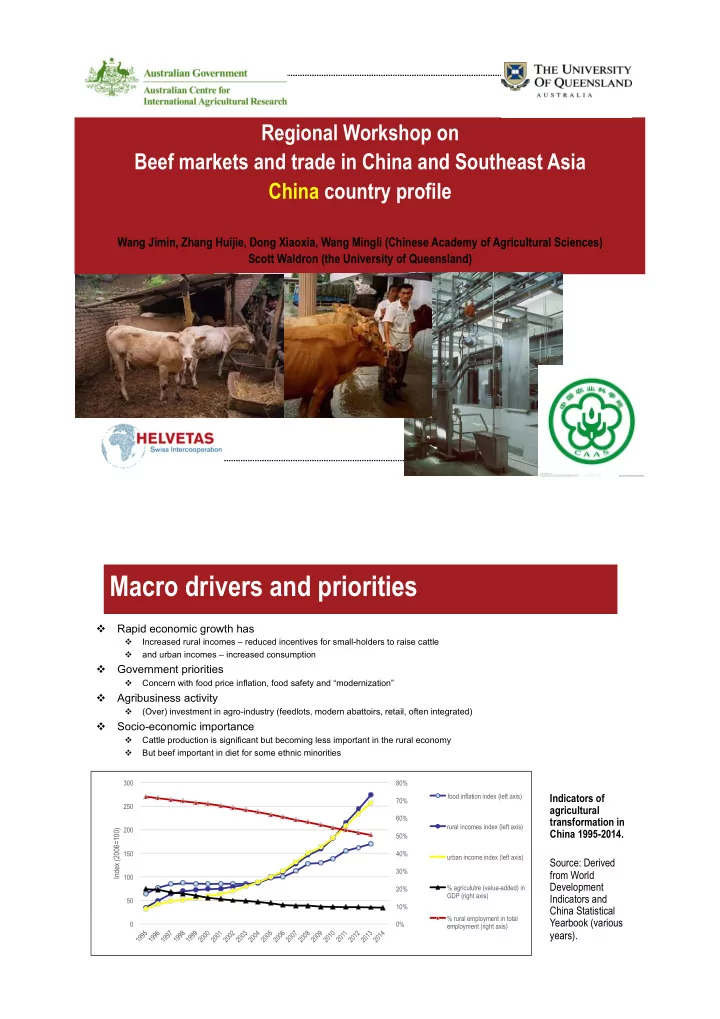
0% 10% 20% 30% 40% 50% 60% 70% 80% 50 100 150 200 250 300

Index (2006=100)

food inflation index (left axis) rural incomes index (left axis) urban income index (left axis) % agriculutre (value-added) in GDP (right axis) % rural employment in total employment (right axis)

Indicators of agricultural transformation in China 1995-2014. Source: Derived from World Development Indicators and China Statistical Yearbook (various years).

slide-2
SLIDE 2

Production indicators

1 2 3 4 5 6 7 8 20 40 60 80 100 120 140 160

Bovine meat output (million tonnes) Bovine numbers and turnoff (million head)

Bovine numbers (left axis) Bovine turnoff (left axis) Bovine meat output (right axis)

Reform from commune era Households allowed to

  • wn livestock

& lease land Agricultural markets liberalised Straw for Beef program Statistical correction 1st agricultral census Statistical correction 2nd agricultral census Advantaged Area program Livestock Law & Food Qulaity & Safety Law "Modern Agriculture" No. 1 Document Beef Quality Grading System introduced State Council Opinion on Accelerating Development of Agricultural Processing State-owned abattoirs expanded but lose monopoly Slaughter bans on draught cattle relaxed Pig Slaughter Management Regulations Revised Food Safety Law

Cow & breeding subsidies

Production trends and policies in the Chinese beef industry, 1979-2013. Source: China Livestock Yearbook (various years) and authors

Regional trends

! West! China! South west! China! Central! Plains! North! east! Other!

Beef cattle distribution by province in China, 2013. Data from China Livestock Yearbook (2014), map generated by authors. One dot equals 10,000 beef cattle. ≈ 300,000 t beef HK ≈ 700,000 t beef, 100,000 cattle Vietnam ≈150,000 cattle Burma, through various routes

slide-3
SLIDE 3

Sub- sectors and chains

Unspecialised cow-calf households Modern abattoirs Uncertified slaughter households Large scale commercial feedlots Specialised cattle feeding households Processing sector Certified centralised slaughter points Production sector Consumption, prices and retailing Marketing sector Open market individualistic trading

by: markets, dealers, agents

Group marketing

through: specialised villages & groups

Contract marketing Generic beef markets

in: Most markets & restaraunts

Mid value beef markets

in: Markets, supermarkets, HRI

Premium beef markets

in: HRI, select supermarkets

Most relevant alignment of industry sub-systems in value chains

Specialisation Scale production Collectivisation Internalisation of costs Scale & modernisation Food safety

Demand for quality attributes Food safety, service

Diversfiication Lower costs Flexibility Externalisation

  • f costs

L

  • w

c

  • s

t Lower cost

L

  • w

c

  • s

t Lower cost

Continuum of agrifood value chains, agricultural modernisation

Low value agrifood chains Mid value agrifood chains High value agrifood chains most relevant alignment in agrifood chains & dominant flow of product Additional product flows across categories Legend

  • f/to

mdernisation Major drivers Major constraints

Segments of the Chinese domestic beef industry Source: authors

Prices

0.0 0.5 1.0 1.5 2.0 2.5 3.0 10 20 30 40 50 60 70 1995 1996 1997 1998 1999 2000 2001 2002 2003 2004 2005 2006 2007 2008 2009 2010 2011 2012 2013 2014 2015 Corn prices (Rmb/kg) Meat prices (Rmb/kg) Beef Mutton Pork Chicken Corn (right axis)

Monthly meat and corn prices in Beijing (1995-2015) Source: China Livestock Yearbook (various years) and Ministry of Agriculture

slide-4
SLIDE 4

Trade

50 100 150 200 250 300 350 400 Year 1992 1993 1994 1995 1996 1997 1998 1999 2000 2001 2002 2003 2004 2005 2006 2007 2008 2009 2010 2011 2012 2013 2014 Beef$traded$(kilotonnes) Mainland4China4beef4imports Hong4Kong4SAR4beef4net4trade China4beef4exports

Beef imports and exports, mainland China and Hong Kong Special Administrative Region (SAR), 1992-2014. Source: UNComtrade (2014)

Informal beef imports:

Perhaps 1 million tonnes of beef entered through informal channels in 2013 Route:

  • 300,000 t through HK
  • Rest through Vietnam and other channels

Source:

  • Brasil 430,000 tonnes
  • India 470,000 tonnes
  • The US 90,000 tonnes

Formal beef imports:

  • 300,000 tonnes in 2013
  • Mainly from Australia

Informal cattle imports:

Perhaps 350,000 cattle entered through the border trade in 2014 (if 200kgs carcass weight = 70,000 tonnes beef):

  • 100,000 cattle from Vietnam
  • 100,000 directly from Burma
  • 150,000 indirectly from Burma through

Thailand and Laos.

But China is cracking down

  • n the informal trade. What

are the implications?

Industry priorities and strategies