
SLIDE 1
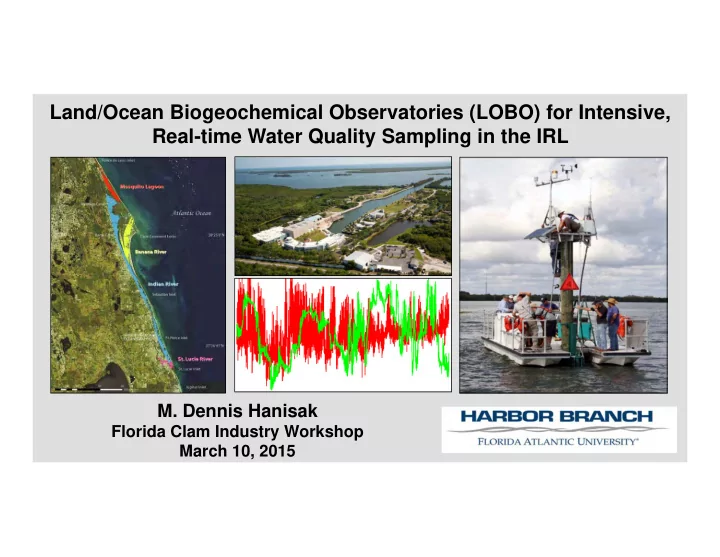
Land/Ocean Biogeochemical Observatories (LOBO) for Intensive, Real-time Water Quality Sampling in the IRL
- M. Dennis Hanisak
Florida Clam Industry Workshop March 10, 2015
Land/Ocean Biogeochemical Observatories (LOBO) for Intensive, - - PowerPoint PPT Presentation
Land/Ocean Biogeochemical Observatories (LOBO) for Intensive, Real-time Water Quality Sampling in the IRL M. Dennis Hanisak Florida Clam Industry Workshop March 10, 2015 Critical Issues Facing the IRL & SLE Excessive freshwater release
Florida Clam Industry Workshop March 10, 2015
Establishing a network of advanced observing stations
WET Labs Cycle-PO4 STOR- X Atlantic SUNA
(behind WQMX)
WET Labs WQMX
Continuous real-time, high- accuracy and high- resolution observatory data available to all through a dedicated interactive website to better quantify and model relationships between environmental factors and biological processes in the IRL
High frequency monitoring provides much more data and captures events missed by discrete sampling
Establishing a network of advanced observing stations
IRLO/LOBO Contact: dhanisak@hboi.fau.edu