
SLIDE 1
20.09.2008 1
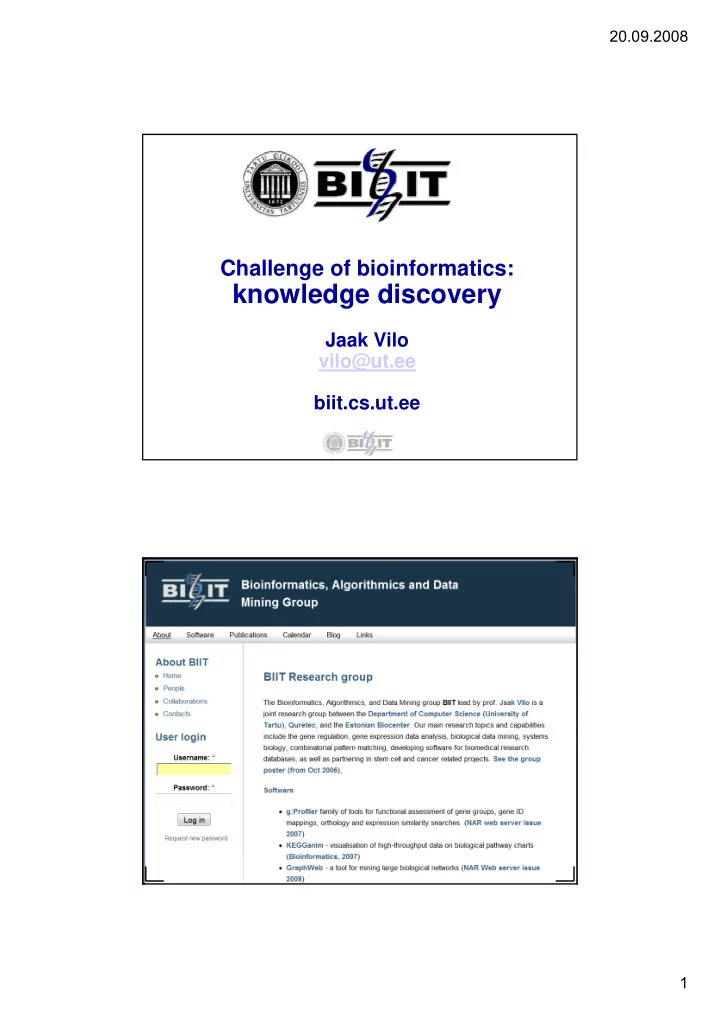
knowledge discovery Jaak Vilo vilo@ut.ee biit.cs.ut.ee 1 - - PDF document
20.09.2008 Challenge of bioinformatics: knowledge discovery Jaak Vilo vilo@ut.ee biit.cs.ut.ee 1 20.09.2008 Bioinformatics Management analysis and Management, analysis and interpretation of biological data Goal: gain new
20.09.2008 1
20.09.2008 2
4 Sep 2008
20.09.2008 3
Total nucleotides (current 216,455,190,745) Number of entries (current 136,401,022) http://www.ebi.ac.uk/embl/Services/DBStats/
20.09.2008 4
Sequence (DNA, RNA,Protein…) S 6340 experiments, 192031 assays available 1 assay = 10-100MB “image”, converted into values for all genes on assay… Structure Variation Gene Expression Protein expression Metabolism Interactions Regulation … Imaging Imaging …
20.09.2008 5
Computer science and bioinformatics Communications of the ACM Volume 48 , Issue 3 (March 2005) The disappearing computer Pages: 72 - 78 Year of Publication: 2005 Jacques Cohen
20.09.2008 6
By Dan Doernberg December 7th, 1993
CLB: If you were a soon-to-graduate college senior or Ph.D. and you didn't have any "baggage", what kind
Knuth: I think the most exciting computer research now is partly in robotics, and
partly in applications to biochemistry partly in applications to biochemistry. Robotics, for example, that's
robotics lab now, and our plan is for a new building that will have a hundred robots walking the corridors, to stimulate the students. It'll be two or three years until we move in to the building. Just seeing robots there, you'll think of neat projects. These projects also suggest a lot of good mathematical and theoretical
I'd love to do that... only one life, you know, but... CLB: Why do you mention biochemistry?
Knuth: There's millions and millions of unsolved problems. Biology is so digital, and incredibly complicated, but incredibly useful. The
trouble with biology is that if you have to work as a biologist it's boring Your experiments take you three trouble with biology is that, if you have to work as a biologist, it s boring. Your experiments take you three years and then, one night, the electricity goes off and all the things die! You start over. In computers we can create our own worlds. Biologists deserve a lot of credit for being able to slug it through. It is hard for me to say confidently that, after fifty more years of explosive growth of computer science, there will still be a lot of fascinating unsolved problems at peoples' fingertips, that it won't be pretty much working on refinements of well-explored things. Maybe all of the simple stuff and the really great stuff has been
computer science as I can about biology. Biology easily has 500 years
Level 1 Level 2
A eukaryotic genome can be thought of as six Levels of
Level 0 ATCGCTGAATTCCAATGTG Level 3 Level 4
six Levels of DNA structure. The loops at Level 4 range from 0.5kb to 100kb in length.
Level 5 Level 6
If these loops were stabilized then the genes inside the loop would not be expressed.
20.09.2008 7
A: B: DNA, gene, RNA, protein, gene regulation, …
Upstream/ promoter Downstream DNA:
20.09.2008 8
Undirected: 5+4+3+2+1 15 Undirected: 5+4+3+2+1=15 Directed graph: 52 = 25 Connection/not: 215 = 32768 A ti t / 315 14348907 H L K Activate/repress: 315= 14348907 20: 1M or 3400M J S
20.09.2008 9
H L K Logical switches on nodes Boolean or continuous Firing thresholds, growth functions? J S
20.09.2008 10
Mid-term Review Mid-term Review
Embryonic Stem Cell (ES) key regulators
collaboration between James Adjaye, Jaak Vilo and Ioannis Xenarios
Embryonic Stem Cell (ES) key regulators
collaboration between James Adjaye, Jaak Vilo and Ioannis Xenarios
OCT4 SOX2 NANOG
20.09.2008 11
siRNA knockdown of SOX2 Identify positively and negatively affected gene lists siRNA knockdown of SOX2 Identify positively and negatively affected gene lists
OCT4 SOX2 NANOG
SOX2 -> SOX2 -|
Network reconstruction using gene expression Network reconstruction using gene expression
OCT4 SOX2 NANOG
SOX2 -> SOX2 -| OCT4 -> OCT4 -| NANOG -> NANOG -|
20.09.2008 12
Network reconstruction using gene expression Network reconstruction using gene expression
http://www.biology.emory.edu/research/Lucchesi/html/research.html
20.09.2008 13
Expression Profiler (2002):
Pattern + Sequence + Expression data combined view
Chapter 3
20.09.2008 14
Chapter 3
Chapter 3
20.09.2008 15
KOexpr motifs KOexpr motifs G1 M/G1 Mbp1+ Mbp1+ Ace2+ Ace2+ Swi4+ Swi5+ Mcm1+ Swi6- Fkh- Swi4+ Swi4+ Mbp1+ Mbp1+ Fkh2- Mcm1+ S KOexpr motifs Swi4+ Swi4+ KOexpr motifs Ace2+ Mcm1+ Swi4+ Swi5+ Fkh2+ KOexpr motifs Swi4+ Swi4+ Fkh1+ Ace2+ S/G2 G2/M Swi6+ Swi6+ Mbp1+ Mcm1 Ace2 Fkh1 Swi6 Fkh2 Swi4 knockout data
Reactome
20.09.2008 16
Embryonic stem cell regulation – Embryonic stem cell regulation – Pathway reconstruction (LKB1, TGFB, …) – Dry-lab and wet-lab connection
– Patient data entry and management Biomarker identification – Biomarker identification
– Data management – Analysis
http://biit.cs.ut.ee/software
20.09.2008 17
Hierarchical clustering is applied in i d t l i gene expression data analysis, number of genes can be 20000+ Each subtree is a cluster. Hierarchy is built Hierarchical clustering: Hierarchy is built by iteratively joining two most similar clusters into a larger one.
20.09.2008 18
20.09.2008 19
20.09.2008 20
Jüri Reimand: GraphWeb. Genome Informatics, CSHL. Nov 1 2007
–
expression correlation
–
protein-protein interactions
–
literature co-occurrence
–
regulation
–
binding site discovery
20.09.2008 21
Jüri Reimand: GraphWeb. Genome Informatics, CSHL. Nov 1 2007
GO: cell cycle, regulation, growth. KEGG: Alzheimer’s disease
.. everything is interconnected
Jüri Reimand: GraphWeb. Genome Informatics, CSHL. Nov 1 2007
IntAct: Protein interactions (PPI), 18773 interactions IntAct: PPI via orthologs from IntAct, 6705 interactions MEM: gene expression similarity over 89 tumor datasets, 46286 interactions Transfac: gene regulation data, 5183 interactions Public datasets for H.sapiens
20.09.2008 22
Jüri Reimand: GraphWeb. Genome Informatics, CSHL. Nov 1 2007
–
Fully connected graphs ~ protein complexes
–
Highly connected nodes ~ transcriptional regulators
–
Specific genes of interest + near neighbors
–
MCL: Markov clustering (van Dongen, 2000), betweenness centrality clustering
Jüri Reimand: GraphWeb. Genome Informatics, CSHL. Nov 1 2007 GO: JAK-STAT cascade, Kinase inhibitor activity Insulin receptor signaling pw. KEGG: Type II diabetes mellitus GO:Transforming growth factor beta signaling pw. embryonic development, gastrulation KEGG: Cell cycle, cancers, WNT pw. GO: Brain development Pigment granule Melanine metabolic process
20.09.2008 23
Jüri Reimand: GraphWeb. Genome Informatics, CSHL. Nov 1 2007
IntAct: Protein interactions (PPI), 18773 interactions IntAct: PPI via orthologs from IntAct, 6705 interactions MEM: gene expression similarity over 89 tumor datasets, 46286 interactions Transfac: gene regulation data, 5183 interactions Public datasets for H.sapiens
20.09.2008 24
20.09.2008 25